
Class enumeration in mixture models
Written by Mohammed Saqr and Sonsoles López-Pernas
Source:vignettes/articles/class-enumeration.Rmd
class-enumeration.RmdFinite mixture models represent population heterogeneity as a small number of unobserved subpopulations, the latent classes, each characterized by its own distribution of the observed indicators (McLachlan and Peel, 2000). In latent profile analysis the class-specific parameters are the means and variances of continuous indicators; in latent class analysis they are the response probabilities of categorical indicators. When observations are nested within higher-level units, the units may themselves differ in the distribution of classes. In the data used here, course enrolments are nested within students, and students differ in the proportion of their enrolments that show a given pattern of engagement. The two-level mixture model of Vermunt (2003) represents this variation with a second, higher-level latent variable whose categories, the group classes, are defined by their distributions over the lower-level profiles. For a fixed number of classes, estimation yields the class sizes and the class-specific parameters. The number of classes, however, is not a parameter of the model: it is specified before estimation, at both levels in a two-level model, and every subsequent inference is conditional on that specification.
Determining the number of classes is difficult because each conventional criterion for model comparison is deficient in a specific respect. The maximized likelihood is non-decreasing in the number of classes, since a model with k + 1 classes contains the model with k classes as a special case. The likelihood ratio test of k against k + 1 classes does not have its usual chi-square reference distribution, because the null hypothesis places a mixing proportion on the boundary of the parameter space and leaves the parameters of the omitted class unidentified (McLachlan and Peel, 2000). Valid p-values can be obtained by parametric bootstrap (McLachlan, 1987), at the cost of refitting both models to many simulated data sets. Information criteria avoid hypothesis testing by penalizing the deviance for the number of estimated parameters; criteria with a weaker penalty, such as the Akaike information criterion, select more classes than criteria with a stronger penalty, such as the Bayesian information criterion (Nylund, Asparouhov and Muthén, 2007).
Applied data introduce further complications. In large samples the Bayesian information criterion frequently continues to decrease as classes are added, because minor misspecifications become detectable and each additional class absorbs part of them. The minimum then falls at the largest model fitted, and the magnitude of successive improvements is more informative than the location of the minimum. In a two-level model the numbers of lower- and higher-level classes must be determined jointly, and the penalty of the Bayesian information criterion depends on whether the sample size is taken as the number of higher-level units or of lower-level observations (Lukočienė, Varriale and Vermunt, 2010). Moreover, a model may fit well yet separate its classes poorly, and the reported solution may be a local rather than the global maximum of the likelihood.
This article applies class enumeration to a two-level latent profile
model. All combinations of the specified numbers of profiles and group
classes are estimated with enumerate_classes(), and every
fitted model is retained. Each candidate is characterized by its
information criteria under both definitions of the sample size, by the
change in a criterion with each additional profile and group class, by
the knee of each resulting curve, by the certainty of its classification
and by diagnostics of its estimation. Selected candidates are then
compared directly, and the chosen candidate is extracted for substantive
analysis.
The full evidence is reported because no single statistic determines the number of classes. Considered jointly, the criteria, the changes between neighbouring candidates and the indices of classification quality indicate where additional classes cease to improve the model, and a decision based on them can be stated, justified and reproduced from the reported tables. Model selection defines each source of evidence and discusses its interpretation and limitations.
Data
The examples use course_engagement, a long-format data
frame with one row per course enrolment, comprising 1,422 enrolments of
106 students. Five measures of course activity serve as indicators:
browsing of the course site, lecture viewing, forum reading, forum
posting and attendance. Each measure is standardized within its course,
so that zero denotes the course mean. The column student
identifies the student to whom each enrolment belongs.
head(course_engagement)
#>   student course sequence browse lectures forum_read forum_post attendance previous_grade
#> 1       1     23        1   0.73    -0.08       0.30       0.67       0.72           0.54
#> 2       1     19        2   0.68     0.53      -0.02      -0.55       0.70          -0.71
#> 3       1      4        3  -1.51    -0.51      -0.91      -0.80      -0.97           1.98
#> 4       1     18        4   0.64    -1.02      -1.62      -1.20      -1.26          -1.42
#> 5       1     16        5  -0.94    -0.37      -0.71      -0.28      -1.52          -0.67
#> 6       1     29        6  -0.36    -0.46      -0.77      -0.43      -1.34          -0.40
#>   engagement student_type
#> 1    engaged     wavering
#> 2    engaged     wavering
#> 3 disengaged     wavering
#> 4 disengaged     wavering
#> 5 disengaged     wavering
#> 6 disengaged     wavering
Because enrolments are nested within students, the profiles describe patterns of activity within a single course, and the group classes describe students by the distribution of their enrolments over those patterns.
Fitting the candidate models
enumerate_classes() takes the data, the indicators
(vars) and the group identifier (id). The
arguments n_profiles and n_group_classes
specify the numbers of classes to be considered, and one model is
estimated for each combination; here the number of profiles ranges from
one to six and the number of group classes from one to four. The
argument model specifies the within-profile covariance
structure. "VVI" assigns each profile its own variances and
constrains the covariances to zero; when model is omitted,
the four basic structures are estimated for every combination.
The likelihood of a mixture model is multimodal, so each model is
estimated from several random starts and the solution with the highest
likelihood is retained. The number of starts is set by
n_starts, which, like every other estimation argument,
applies identically to all candidates. Three starts per model are used
here to limit computation; applied analyses should use at least ten, and
a grid is re-estimated in its entirety when more starts are required, so
that every candidate has the same opportunity to reach its maximum. The
argument seed makes the starts reproducible. When many
starts are used, a candidate with more profiles than the data support
can reach a degenerate solution in which one profile collapses on a
single observation with every variance at its lower bound; its
likelihood, and hence its criteria, then depend on
min_variance rather than on the data.
boundary = "exclude" sets such starts aside for every
candidate (see Diagnostics of the estimation).
activity <- c("browse", "lectures", "forum_read", "forum_post", "attendance")
models <- enumerate_classes(course_engagement, activity, "student",
                            n_profiles = 1:6, n_group_classes = 1:4,
                            model = "VVI", n_starts = 3, seed = 1)
models
#> Class enumeration: 24 candidate models
#>          candidate n_profiles n_group_classes model log_likelihood n_parameters   aic bic_groups
#>  profiles1_groups1          1               1   VVI         -10007           10 20035      20062
#>  profiles2_groups1          2               1   VVI          -8615           21 17272      17328
#>  profiles3_groups1          3               1   VVI          -8537           32 17137      17222
#>  profiles4_groups1          4               1   VVI          -8501           43 17088      17203
#>  profiles5_groups1          5               1   VVI          -8484           54 17077      17220
#>  profiles6_groups1          6               1   VVI          -8481           65 17093      17266
#>  profiles1_groups2          1               2   VVI             NA           NA    NA         NA
#>  profiles2_groups2          2               2   VVI          -8440           23 16926      16987
#>  profiles3_groups2          3               2   VVI          -8365           35 16799      16892
#>  profiles4_groups2          4               2   VVI          -8326           47 16746      16872
#>  profiles5_groups2          5               2   VVI          -8309           59 16735      16892
#>  profiles6_groups2          6               2   VVI          -8297           71 16737      16926
#>  profiles1_groups3          1               3   VVI             NA           NA    NA         NA
#>  profiles2_groups3          2               3   VVI          -8421           25 16892      16959
#>  profiles3_groups3          3               3   VVI          -8348           38 16773      16874
#>  profiles4_groups3          4               3   VVI          -8307           51 16716      16852
#>  profiles5_groups3          5               3   VVI          -8291           64 16709      16880
#>  profiles6_groups3          6               3   VVI          -8279           77 16712      16917
#>  profiles1_groups4          1               4   VVI             NA           NA    NA         NA
#>  profiles2_groups4          2               4   VVI          -8415           27 16884      16956
#>  profiles3_groups4          3               4   VVI          -8343           41 16767      16876
#>  profiles4_groups4          4               4   VVI          -8301           55 16711      16858
#>  profiles5_groups4          5               4   VVI          -8283           69 16704      16887
#>  profiles6_groups4          6               4   VVI          -8268           83 16703      16924
#>  bic_individual icl_individual profile_entropy group_entropy avepp_min avepp_max avepp_mean
#>           20088          20088              NA            NA        NA        NA         NA
#>           17383          17537           0.922            NA     0.974     0.982      0.978
#>           17306          18017           0.772            NA     0.832     0.964      0.886
#>           17314          18359           0.735            NA     0.803     0.849      0.835
#>           17361          18401           0.773            NA     0.804     0.962      0.861
#>           17435          19124           0.669            NA     0.627     0.812      0.729
#>              NA             NA              NA            NA        NA        NA         NA
#>           17047          17168           0.938         0.940     0.982     0.985      0.983
#>           16983          17640           0.790         0.943     0.849     0.979      0.893
#>           16994          18021           0.739         0.937     0.791     0.858      0.835
#>           17045          18076           0.775         0.965     0.803     0.860      0.839
#>           17110          18476           0.732         0.946     0.699     0.845      0.780
#>              NA             NA              NA            NA        NA        NA         NA
#>           17024          17142           0.940         0.816     0.982     0.986      0.984
#>           16973          17622           0.792         0.797     0.845     0.978      0.892
#>           16985          18014           0.739         0.823     0.801     0.854      0.836
#>           17046          18353           0.714         0.854     0.628     0.843      0.779
#>           17117          18780           0.674         0.853     0.655     0.795      0.743
#>              NA             NA              NA            NA        NA        NA         NA
#>           17026          17140           0.942         0.798     0.984     0.986      0.985
#>           16983          17630           0.793         0.772     0.843     0.980      0.892
#>           17000          18027           0.740         0.803     0.801     0.853      0.837
#>           17067          18207           0.751         0.830     0.786     0.853      0.820
#>           17139          18540           0.725         0.851     0.654     0.847      0.783
#>  avepp_below group_avepp_min group_avepp_max group_avepp_mean group_avepp_below converged boundary
#>           NA              NA              NA               NA                NA      TRUE    FALSE
#>            0              NA              NA               NA                NA      TRUE    FALSE
#>            0              NA              NA               NA                NA      TRUE    FALSE
#>            0              NA              NA               NA                NA      TRUE    FALSE
#>            0              NA              NA               NA                NA      TRUE    FALSE
#>            5              NA              NA               NA                NA      TRUE    FALSE
#>           NA              NA              NA               NA                NA     FALSE       NA
#>            0           0.969           0.992            0.980                 0      TRUE    FALSE
#>            0           0.977           0.992            0.985                 0      TRUE    FALSE
#>            1           0.975           0.990            0.983                 0      TRUE    FALSE
#>            0           0.990           0.996            0.993                 0      TRUE    FALSE
#>            4           0.972           0.987            0.979                 0      TRUE    FALSE
#>           NA              NA              NA               NA                NA     FALSE       NA
#>            0           0.900           0.962            0.923                 0      TRUE    FALSE
#>            0           0.864           0.977            0.913                 0      TRUE    FALSE
#>            0           0.874           0.981            0.923                 0      TRUE    FALSE
#>            1           0.917           0.987            0.941                 0      TRUE    FALSE
#>            6           0.915           0.984            0.941                 0      TRUE    FALSE
#>           NA              NA              NA               NA                NA     FALSE       NA
#>            0           0.851           0.912            0.877                 0      TRUE    FALSE
#>            0           0.841           0.902            0.864                 0      TRUE    FALSE
#>            0           0.867           0.903            0.885                 0      TRUE    FALSE
#>            1           0.882           0.926            0.904                 0      TRUE    FALSE
#>            3           0.898           0.940            0.916                 0      TRUE    FALSE
#>  n_best_replicated
#>                  3
#>                  3
#>                  3
#>                  3
#>                  1
#>                  1
#>                 NA
#>                  3
#>                  3
#>                  3
#>                  2
#>                  1
#>                 NA
#>                  3
#>                  3
#>                  3
#>                  2
#>                  2
#>                 NA
#>                  3
#>                  3
#>                  2
#>                  1
#>                  1
#> 3 candidate(s) did not converge; see as.data.frame(x).
#> No candidate is selected automatically. Compare one convention consistently.
The result contains 24 candidates. Each is named by its numbers of
profiles and group classes (profiles4_groups3 denotes four
profiles and three group classes), and this name identifies the
candidate in all subsequent functions. The 3 candidates with a single
profile and more than one group class are not identified: group classes
are defined by differences in the distribution of profiles, and with a
single profile no such differences exist. These candidates are retained
in the table together with the error that terminated their
estimation.
The table of candidates
as.data.frame() returns one row per candidate.
as.data.frame(models)
#> candidate n_profiles n_group_classes model log_likelihood n_parameters aic kic
#> 1 profiles1_groups1 1 1 VVI -10007 10 20035 20048
#> 2 profiles2_groups1 2 1 VVI -8615 21 17272 17296
#> 3 profiles3_groups1 3 1 VVI -8537 32 17137 17172
#> 4 profiles4_groups1 4 1 VVI -8501 43 17088 17134
#> 5 profiles5_groups1 5 1 VVI -8484 54 17077 17134
#> 6 profiles6_groups1 6 1 VVI -8481 65 17093 17161
#> 7 profiles1_groups2 1 2 VVI NA NA NA NA
#> 8 profiles2_groups2 2 2 VVI -8440 23 16926 16952
#> 9 profiles3_groups2 3 2 VVI -8365 35 16799 16837
#> 10 profiles4_groups2 4 2 VVI -8326 47 16746 16796
#> 11 profiles5_groups2 5 2 VVI -8309 59 16735 16797
#> 12 profiles6_groups2 6 2 VVI -8297 71 16737 16811
#> 13 profiles1_groups3 1 3 VVI NA NA NA NA
#> 14 profiles2_groups3 2 3 VVI -8421 25 16892 16920
#> 15 profiles3_groups3 3 3 VVI -8348 38 16773 16814
#> 16 profiles4_groups3 4 3 VVI -8307 51 16716 16770
#> 17 profiles5_groups3 5 3 VVI -8291 64 16709 16776
#> 18 profiles6_groups3 6 3 VVI -8279 77 16712 16792
#> 19 profiles1_groups4 1 4 VVI NA NA NA NA
#> 20 profiles2_groups4 2 4 VVI -8415 27 16884 16914
#> 21 profiles3_groups4 3 4 VVI -8343 41 16767 16811
#> 22 profiles4_groups4 4 4 VVI -8301 55 16711 16769
#> 23 profiles5_groups4 5 4 VVI -8283 69 16704 16776
#> 24 profiles6_groups4 6 4 VVI -8268 83 16703 16789
#> bic_groups bic_individual sabic_groups sabic_individual caic_groups caic_individual awe_groups
#> 1 20062 20088 20030 20056 20072 20098 20138
#> 2 17328 17383 17262 17316 17349 17404 17489
#> 3 17222 17306 17121 17204 17254 17338 17468
#> 4 17203 17314 17067 17178 17246 17357 17532
#> 5 17220 17361 17050 17189 17274 17415 17634
#> 6 17266 17435 17061 17228 17331 17500 17764
#> 7 NA NA NA NA NA NA NA
#> 8 16987 17047 16914 16974 17010 17070 17172
#> 9 16892 16983 16782 16872 16927 17018 17169
#> 10 16872 16994 16723 16844 16919 17041 17241
#> 11 16892 17045 16706 16858 16951 17104 17350
#> 12 16926 17110 16701 16884 16997 17181 17478
#> 13 NA NA NA NA NA NA NA
#> 14 16959 17024 16880 16944 16984 17049 17193
#> 15 16874 16973 16754 16852 16912 17011 17212
#> 16 16852 16985 16691 16823 16903 17036 17284
#> 17 16880 17046 16677 16842 16944 17110 17404
#> 18 16917 17117 16674 16872 16994 17194 17541
#> 19 NA NA NA NA NA NA NA
#> 20 16956 17026 16871 16941 16983 17053 17223
#> 21 16876 16983 16747 16853 16917 17024 17258
#> 22 16858 17000 16684 16826 16913 17055 17337
#> 23 16887 17067 16669 16847 16956 17136 17466
#> 24 16924 17139 16661 16876 17007 17222 17604
#> awe_individual icl_groups icl_individual clc_groups clc_individual profile_entropy group_entropy
#> 1 20190 20062 20088 20015 20015 NA NA
#> 2 17753 17328 17537 17230 17385 0.922 NA
#> 3 18345 17222 18017 17073 17785 0.772 NA
#> 4 18800 17203 18359 17002 18047 0.735 NA
#> 5 18955 17220 18401 16969 18009 0.773 NA
#> 6 19791 17266 19124 16963 18652 0.669 NA
#> 7 NA NA NA NA NA NA NA
#> 8 17404 16996 17168 16889 17002 0.938 0.940
#> 9 18000 16901 17640 16737 17386 0.790 0.943
#> 10 18503 16881 18021 16662 17680 0.739 0.937
#> 11 18682 16897 18076 16622 17648 0.775 0.965
#> 12 19205 16934 18476 16602 17961 0.732 0.946
#> 13 NA NA NA NA NA NA NA
#> 14 17398 17001 17142 16885 16960 0.940 0.816
#> 15 18012 16921 17622 16744 17346 0.792 0.797
#> 16 18537 16893 18014 16656 17644 0.739 0.823
#> 17 19010 16914 18353 16615 17888 0.714 0.854
#> 18 19570 16951 18780 16592 18221 0.674 0.853
#> 19 NA NA NA NA NA NA NA
#> 20 17417 17016 17140 16890 16944 0.942 0.798
#> 21 18051 16943 17630 16752 17332 0.793 0.772
#> 22 18592 16916 18027 16659 17628 0.740 0.803
#> 23 18915 16937 18207 16616 17706 0.751 0.830
#> 24 19392 16967 18540 16580 17938 0.725 0.851
#> avepp_min avepp_max avepp_mean avepp_below group_avepp_min group_avepp_max group_avepp_mean
#> 1 NA NA NA NA NA NA NA
#> 2 0.974 0.982 0.978 0 NA NA NA
#> 3 0.832 0.964 0.886 0 NA NA NA
#> 4 0.803 0.849 0.835 0 NA NA NA
#> 5 0.804 0.962 0.861 0 NA NA NA
#> 6 0.627 0.812 0.729 5 NA NA NA
#> 7 NA NA NA NA NA NA NA
#> 8 0.982 0.985 0.983 0 0.969 0.992 0.980
#> 9 0.849 0.979 0.893 0 0.977 0.992 0.985
#> 10 0.791 0.858 0.835 1 0.975 0.990 0.983
#> 11 0.803 0.860 0.839 0 0.990 0.996 0.993
#> 12 0.699 0.845 0.780 4 0.972 0.987 0.979
#> 13 NA NA NA NA NA NA NA
#> 14 0.982 0.986 0.984 0 0.900 0.962 0.923
#> 15 0.845 0.978 0.892 0 0.864 0.977 0.913
#> 16 0.801 0.854 0.836 0 0.874 0.981 0.923
#> 17 0.628 0.843 0.779 1 0.917 0.987 0.941
#> 18 0.655 0.795 0.743 6 0.915 0.984 0.941
#> 19 NA NA NA NA NA NA NA
#> 20 0.984 0.986 0.985 0 0.851 0.912 0.877
#> 21 0.843 0.980 0.892 0 0.841 0.902 0.864
#> 22 0.801 0.853 0.837 0 0.867 0.903 0.885
#> 23 0.786 0.853 0.820 1 0.882 0.926 0.904
#> 24 0.654 0.847 0.783 3 0.898 0.940 0.916
#> group_avepp_below converged boundary n_best_replicated warnings
#> 1 NA TRUE FALSE 3
#> 2 NA TRUE FALSE 3
#> 3 NA TRUE FALSE 3
#> 4 NA TRUE FALSE 3
#> 5 NA TRUE FALSE 1
#> 6 NA TRUE FALSE 1
#> 7 NA FALSE NA NA
#> 8 0 TRUE FALSE 3
#> 9 0 TRUE FALSE 3
#> 10 0 TRUE FALSE 3
#> 11 0 TRUE FALSE 2
#> 12 0 TRUE FALSE 1
#> 13 NA FALSE NA NA
#> 14 0 TRUE FALSE 3
#> 15 0 TRUE FALSE 3
#> 16 0 TRUE FALSE 3
#> 17 0 TRUE FALSE 2
#> 18 0 TRUE FALSE 2
#> 19 NA FALSE NA NA
#> 20 0 TRUE FALSE 3
#> 21 0 TRUE FALSE 3
#> 22 0 TRUE FALSE 2
#> 23 0 TRUE FALSE 1
#> 24 0 TRUE FALSE 1
#> error
#> 1 <NA>
#> 2 <NA>
#> 3 <NA>
#> 4 <NA>
#> 5 <NA>
#> 6 <NA>
#> 7 Multiple group classes are not identifiable with one profile or only singleton groups.
#> 8 <NA>
#> 9 <NA>
#> 10 <NA>
#> 11 <NA>
#> 12 <NA>
#> 13 Multiple group classes are not identifiable with one profile or only singleton groups.
#> 14 <NA>
#> 15 <NA>
#> 16 <NA>
#> 17 <NA>
#> 18 <NA>
#> 19 Multiple group classes are not identifiable with one profile or only singleton groups.
#> 20 <NA>
#> 21 <NA>
#> 22 <NA>
#> 23 <NA>
#> 24 <NA>The columns form the following groups.
| Columns | Content |
|---|---|
candidate, n_profiles,
n_group_classes, model
|
Identity of the candidate |
log_likelihood, n_parameters
|
Fit and size |
aic, kic, bic_*,
sabic_*, caic_*, awe_*,
icl_*, clc_*
|
Information criteria |
profile_entropy, group_entropy
|
Relative entropy at each level |
avepp_min, avepp_max,
avepp_mean, avepp_below
|
Average posterior probability of the profiles |
group_avepp_min, group_avepp_max,
group_avepp_mean, group_avepp_below
|
Average posterior probability of the group classes |
converged, boundary,
n_best_replicated, warnings,
error
|
Diagnostics of the estimation |
Information criteria
An information criterion is the deviance, minus twice the maximized
log-likelihood, plus a penalty for the estimated parameters; lower
values indicate a more favourable balance of fit and complexity. In a
two-level model the penalty of several criteria depends on the sample
size. Criteria with the suffix _groups treat the 106
students as the independent units, and criteria with the suffix
_individual the 1,422 enrolments (Lukočienė, Varriale and
Vermunt, 2010). A single convention should be used throughout an
analysis.
The candidate that minimizes each criterion:
get_results(models, "best")
#>    criterion  convention         candidate n_profiles n_group_classes model value
#> 1        aic        <NA> profiles6_groups4          6               4   VVI 16703
#> 2        kic        <NA> profiles4_groups4          4               4   VVI 16769
#> 3        bic      groups profiles4_groups3          4               3   VVI 16852
#> 4        bic individuals profiles3_groups3          3               3   VVI 16973
#> 5      sabic      groups profiles6_groups4          6               4   VVI 16661
#> 6      sabic individuals profiles4_groups3          4               3   VVI 16823
#> 7       caic      groups profiles4_groups3          4               3   VVI 16903
#> 8       caic individuals profiles3_groups3          3               3   VVI 17011
#> 9        awe      groups profiles3_groups2          3               2   VVI 17169
#> 10       awe individuals profiles2_groups3          2               3   VVI 17398
#> 11       icl      groups profiles4_groups2          4               2   VVI 16881
#> 12       icl individuals profiles2_groups4          2               4   VVI 17140
#> 13       clc      groups profiles6_groups4          6               4   VVI 16580
#> 14       clc individuals profiles2_groups4          2               4   VVI 16944
The criteria do not agree. With students as the units, the Bayesian information criterion (BIC; Schwarz, 1978) is minimized by profiles4_groups3, the integrated completed likelihood (ICL; Biernacki, Celeux and Govaert, 2000) by profiles4_groups2 and the approximate weight of evidence (AWE; Banfield and Raftery, 1993) by profiles3_groups2. With enrolments as the units, BIC is minimized by profiles3_groups3. The Akaike information criterion (AIC; Akaike, 1974) is minimized by profiles6_groups4, the largest candidate, because its weak penalty leaves it decreasing over the entire range. ICL and AWE penalize classification uncertainty in addition to the number of parameters and therefore favour fewer, better separated classes.
The criteria are plotted against the number of profiles, with one line per number of group classes and the minimum of each criterion circled.
plot_enumeration(models)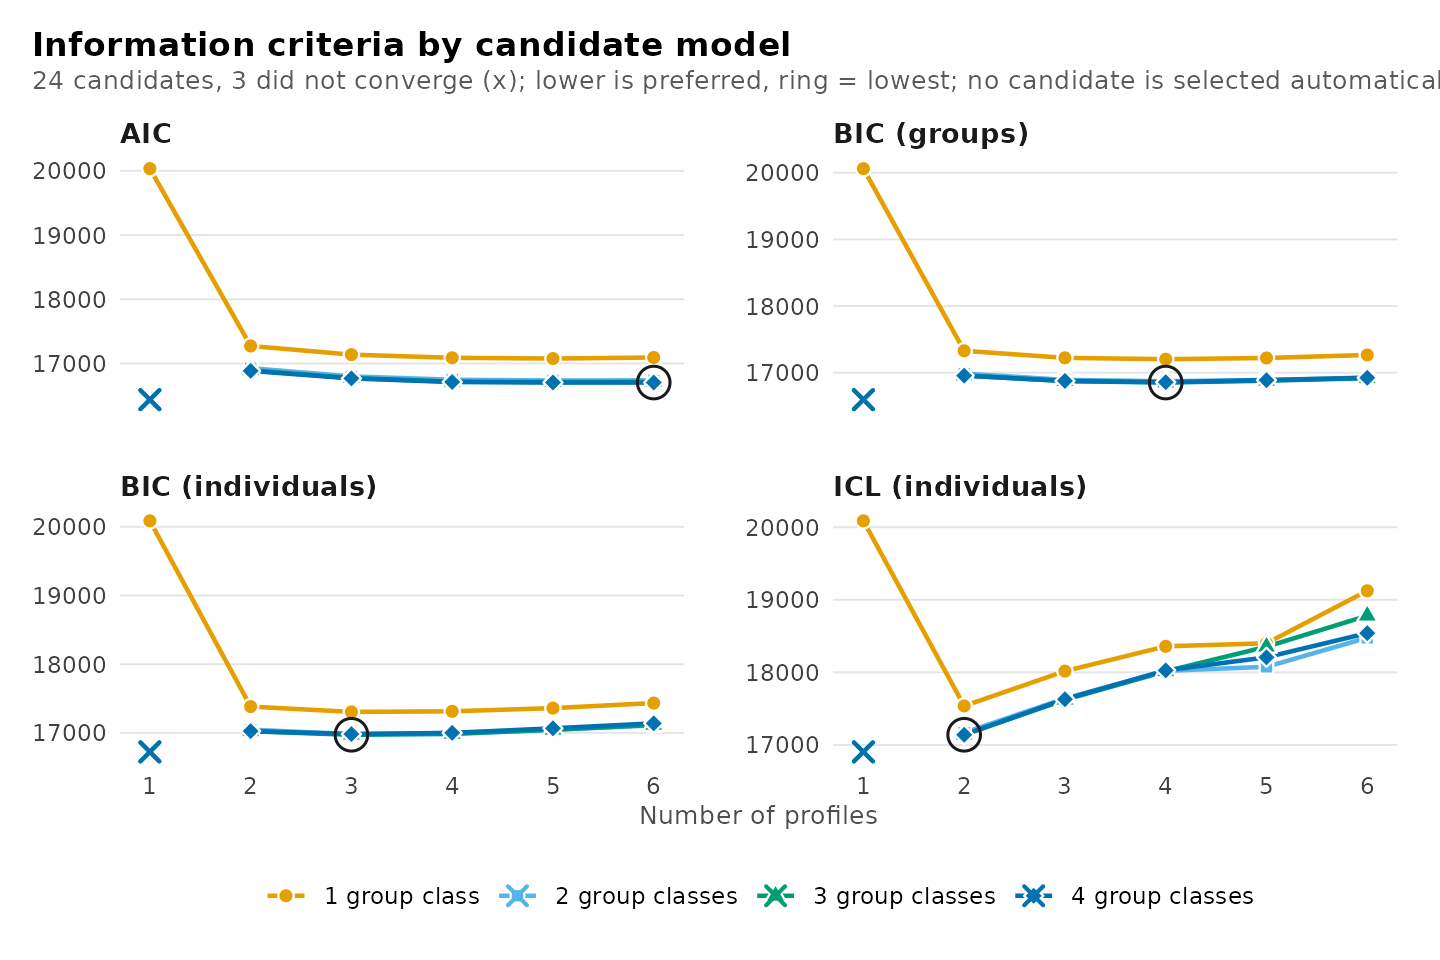
A minimum at the largest number of profiles or group classes
considered indicates that the criterion is still decreasing at the
boundary of the grid, which should then be extended until the minimum is
interior. Any criterion can be plotted by name, and
what = "all" plots all of them.
plot_enumeration(models, what = "bic_groups")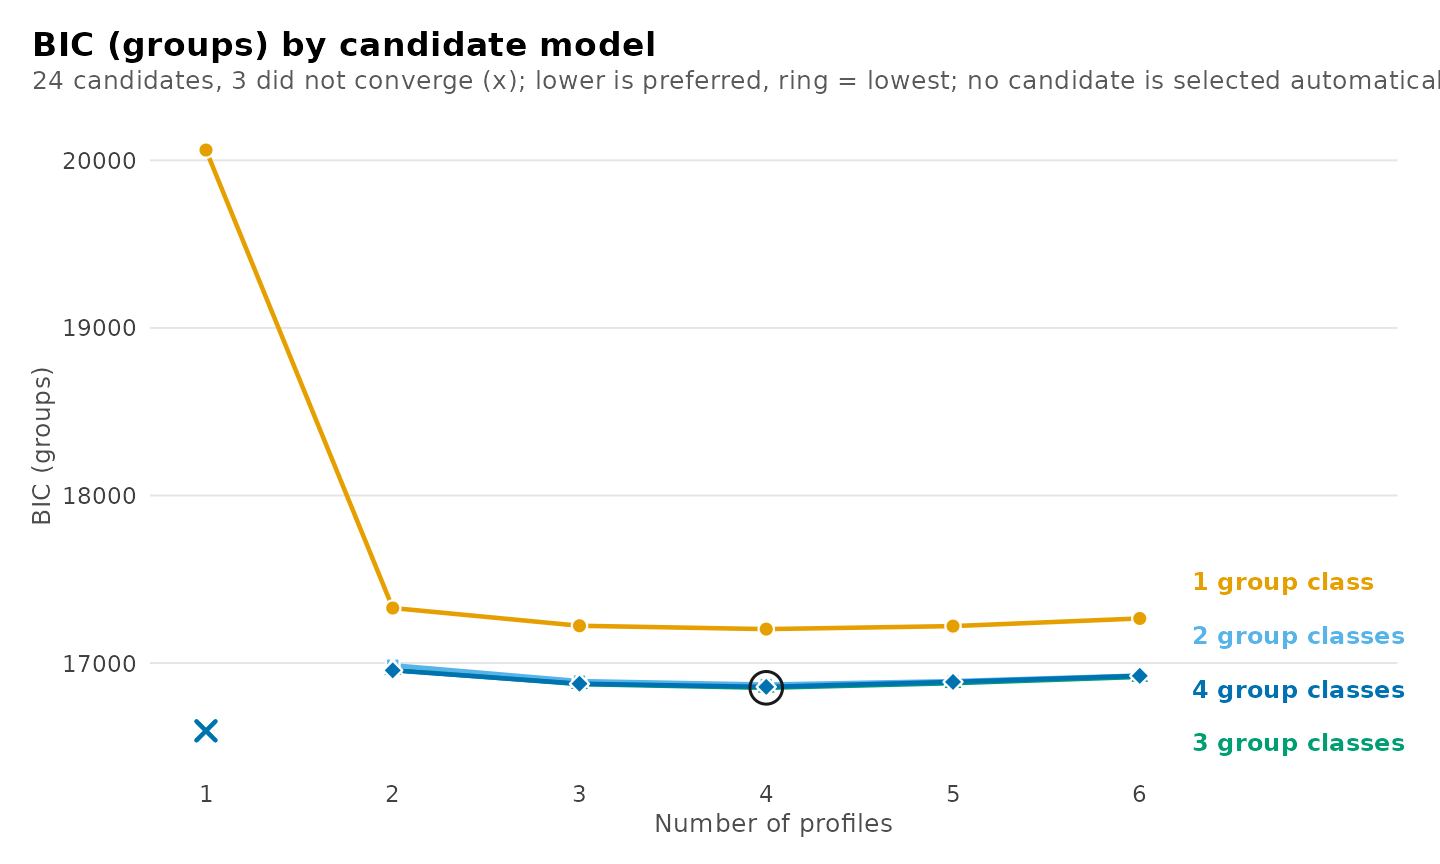
The clustering tree (Zappia and Oshlack, 2018) shows how the profiles
divide as their number increases: each profile of a model is linked to
the profiles of the next larger model that receive its observations.
Each number of group classes has its own tree, selected with
n_group_classes; without it, every tree is returned as a
separate plot. The guide Tree plot covers the comparison of
solutions at one number of profiles and the tree of group classes.
plot_tree(models, n_group_classes = 1)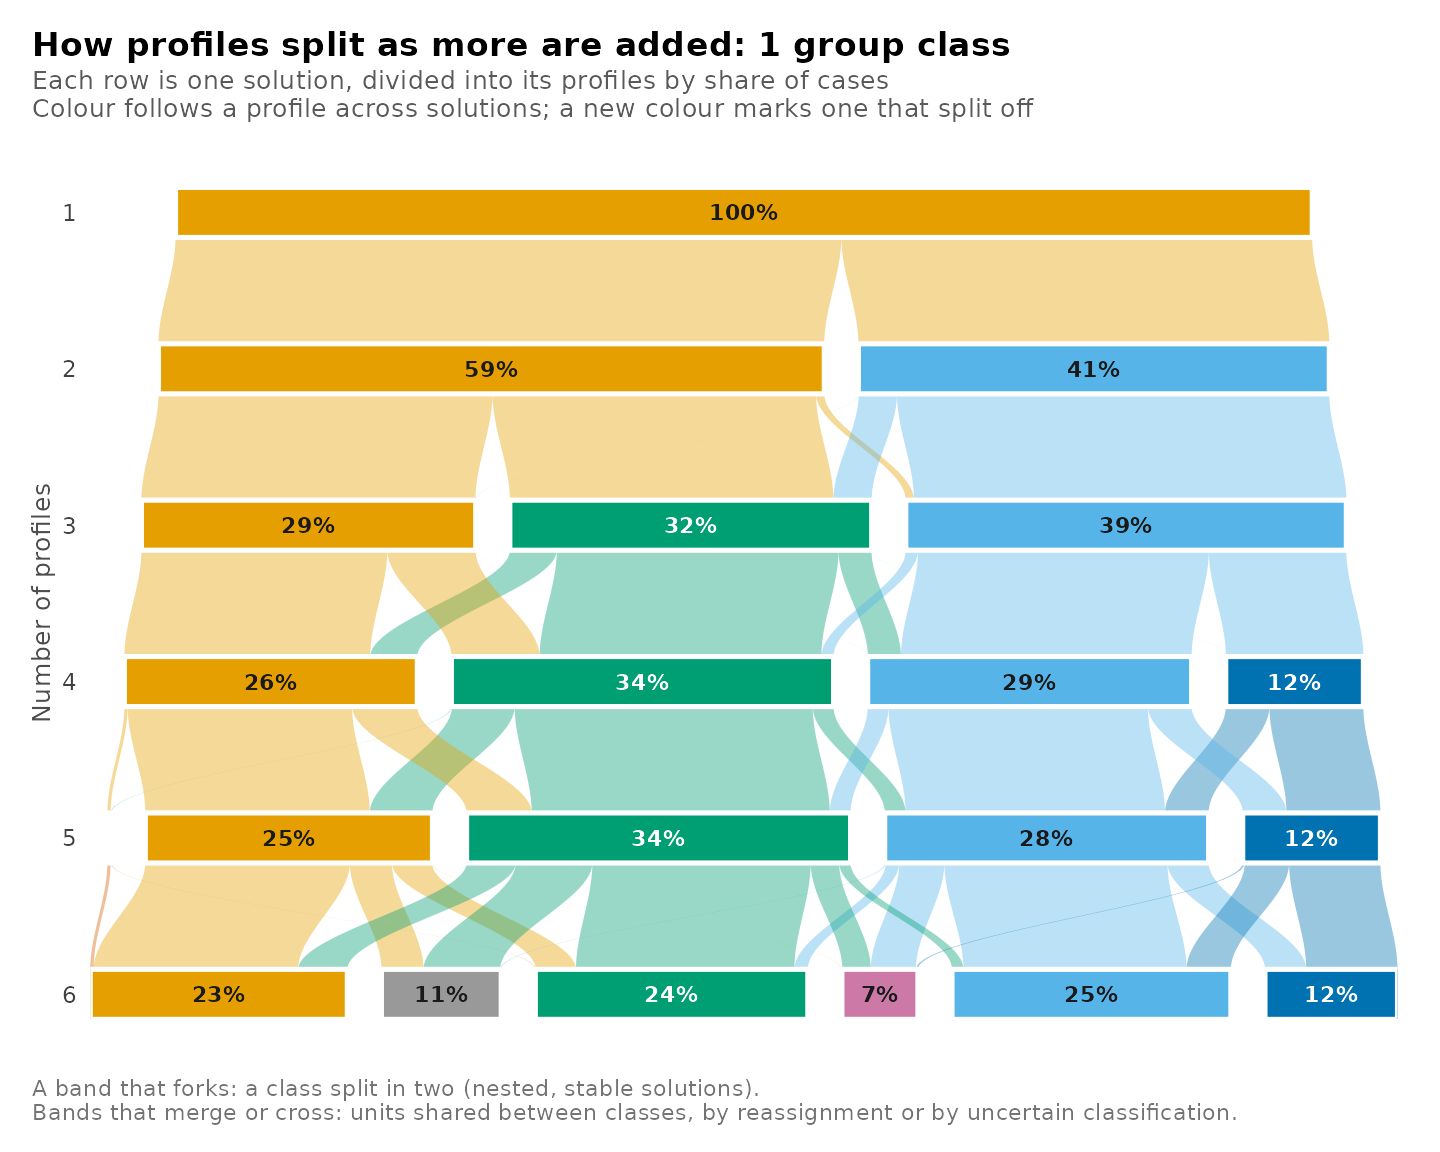
Change with each additional class
When a criterion decreases over the entire range, the magnitude of
each decrease constitutes the evidence. For each candidate, the table
reports the decrease in BIC relative to the candidate with one profile
fewer and the same number of group classes, and relative to the
candidate with one group class fewer and the same number of profiles. A
positive value indicates that the additional class lowered the
criterion. Another criterion is selected with using.
get_results(models, "deltas")
#>            candidate n_profiles n_group_classes model  criterion value delta_profile
#> 1  profiles1_groups1          1               1   VVI bic_groups 20062            NA
#> 2  profiles2_groups1          2               1   VVI bic_groups 17328        2733.2
#> 3  profiles3_groups1          3               1   VVI bic_groups 17222         105.9
#> 4  profiles4_groups1          4               1   VVI bic_groups 17203          19.9
#> 5  profiles5_groups1          5               1   VVI bic_groups 17220         -17.9
#> 6  profiles6_groups1          6               1   VVI bic_groups 17266         -45.6
#> 7  profiles1_groups2          1               2   VVI bic_groups    NA            NA
#> 8  profiles2_groups2          2               2   VVI bic_groups 16987            NA
#> 9  profiles3_groups2          3               2   VVI bic_groups 16892          94.6
#> 10 profiles4_groups2          4               2   VVI bic_groups 16872          20.7
#> 11 profiles5_groups2          5               2   VVI bic_groups 16892         -20.6
#> 12 profiles6_groups2          6               2   VVI bic_groups 16926         -33.5
#> 13 profiles1_groups3          1               3   VVI bic_groups    NA            NA
#> 14 profiles2_groups3          2               3   VVI bic_groups 16959            NA
#> 15 profiles3_groups3          3               3   VVI bic_groups 16874          84.6
#> 16 profiles4_groups3          4               3   VVI bic_groups 16852          21.9
#> 17 profiles5_groups3          5               3   VVI bic_groups 16880         -27.5
#> 18 profiles6_groups3          6               3   VVI bic_groups 16917         -37.5
#> 19 profiles1_groups4          1               4   VVI bic_groups    NA            NA
#> 20 profiles2_groups4          2               4   VVI bic_groups 16956            NA
#> 21 profiles3_groups4          3               4   VVI bic_groups 16876          79.9
#> 22 profiles4_groups4          4               4   VVI bic_groups 16858          18.8
#> 23 profiles5_groups4          5               4   VVI bic_groups 16887         -29.7
#> 24 profiles6_groups4          6               4   VVI bic_groups 16924         -36.3
#>         from_profile delta_group_class  from_group_class
#> 1               <NA>                NA              <NA>
#> 2  profiles1_groups1                NA              <NA>
#> 3  profiles2_groups1                NA              <NA>
#> 4  profiles3_groups1                NA              <NA>
#> 5  profiles4_groups1                NA              <NA>
#> 6  profiles5_groups1                NA              <NA>
#> 7               <NA>                NA              <NA>
#> 8               <NA>            341.51 profiles2_groups1
#> 9  profiles2_groups2            330.20 profiles3_groups1
#> 10 profiles3_groups2            330.96 profiles4_groups1
#> 11 profiles4_groups2            328.23 profiles5_groups1
#> 12 profiles5_groups2            340.42 profiles6_groups1
#> 13              <NA>                NA              <NA>
#> 14              <NA>             28.18 profiles2_groups2
#> 15 profiles2_groups3             18.19 profiles3_groups2
#> 16 profiles3_groups3             19.43 profiles4_groups2
#> 17 profiles4_groups3             12.55 profiles5_groups2
#> 18 profiles5_groups3              8.51 profiles6_groups2
#> 19              <NA>                NA              <NA>
#> 20              <NA>              2.37 profiles2_groups3
#> 21 profiles2_groups4             -2.43 profiles3_groups3
#> 22 profiles3_groups4             -5.54 profiles4_groups3
#> 23 profiles4_groups4             -7.79 profiles5_groups3
#> 24 profiles5_groups4             -6.62 profiles6_groups3
With three group classes, a third profile lowers BIC by 85 and a fourth by 22, whereas a fifth raises it by 27, which the table reports as a negative decrease. The decreases are plotted in both directions, along the number of profiles (left) and along the number of group classes (right).
plot_selection(models, what = "deltas")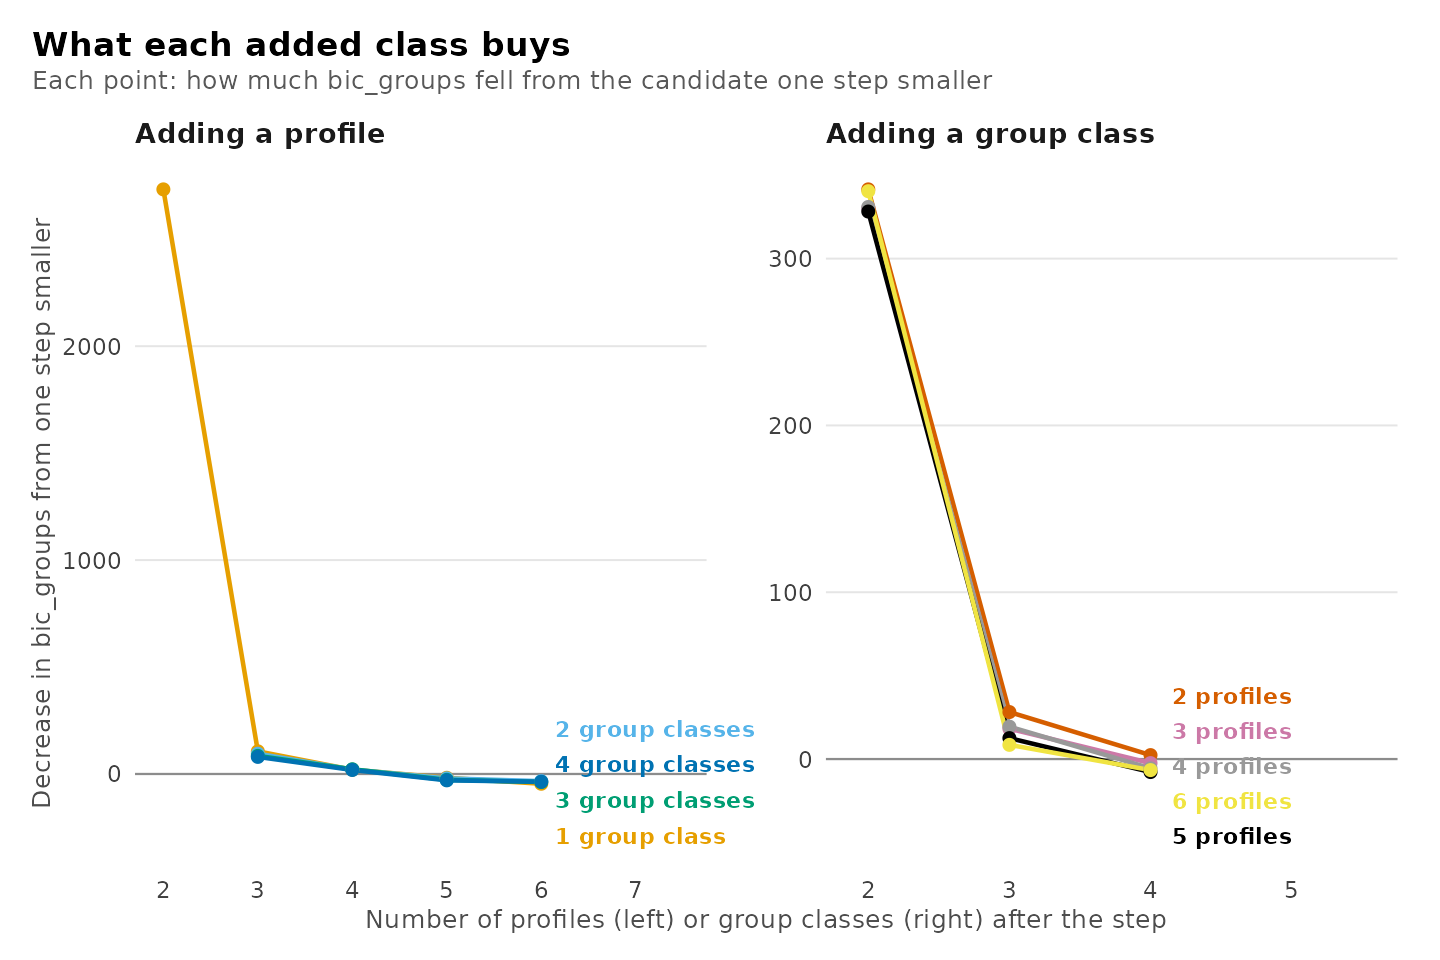
The knee summary rescales both axes of a curve to the unit interval and identifies the candidate at the greatest perpendicular distance below the chord joining the first and last points. The rule follows the geometric definition of Kneedle (Satopää et al., 2011) without its smoothing and sensitivity threshold. A nearly linear curve yields a small maximum distance, so the reported distance indicates the strength of the bend as well as its location. Knees are computed along the number of profiles for each number of group classes, along the number of group classes for each number of profiles, and across all candidates ordered by their number of parameters.
get_results(models, "knees")
#>        direction            line  criterion              from                to n_points
#> 1       profiles   1 group class bic_groups profiles1_groups1 profiles6_groups1        6
#> 2       profiles 2 group classes bic_groups profiles2_groups2 profiles6_groups2        5
#> 3       profiles 3 group classes bic_groups profiles2_groups3 profiles6_groups3        5
#> 4       profiles 4 group classes bic_groups profiles2_groups4 profiles6_groups4        5
#> 5  group_classes       1 profile bic_groups profiles1_groups1 profiles1_groups1        1
#> 6  group_classes      2 profiles bic_groups profiles2_groups1 profiles2_groups4        4
#> 7  group_classes      3 profiles bic_groups profiles3_groups1 profiles3_groups4        4
#> 8  group_classes      4 profiles bic_groups profiles4_groups1 profiles4_groups4        4
#> 9  group_classes      5 profiles bic_groups profiles5_groups1 profiles5_groups4        4
#> 10 group_classes      6 profiles bic_groups profiles6_groups1 profiles6_groups4        4
#> 11    parameters  all candidates bic_groups profiles1_groups1 profiles6_groups4       21
#>       knee_candidate distance knee_without_largest stable                               note
#> 1  profiles2_groups1    0.544    profiles2_groups1   TRUE
#> 2  profiles4_groups2    0.648    profiles3_groups2  FALSE moves when the largest is left out
#> 3  profiles4_groups3    0.750    profiles3_groups3  FALSE moves when the largest is left out
#> 4  profiles4_groups4    0.792    profiles3_groups4  FALSE moves when the largest is left out
#> 5               <NA>       NA                 <NA>     NA        fewer than three candidates
#> 6  profiles2_groups2    0.413    profiles2_groups2   TRUE
#> 7  profiles3_groups2    0.438    profiles3_groups2   TRUE
#> 8  profiles4_groups2    0.439    profiles4_groups2   TRUE
#> 9  profiles5_groups2    0.456    profiles5_groups2   TRUE
#> 10 profiles6_groups2    0.463    profiles6_groups2   TRUE
#> 11 profiles2_groups2    0.561    profiles2_groups2   TRUE
With three group classes, the knee along the number of profiles is
profiles4_groups3. Because the chord terminates at the largest
candidate, the knee depends on the range of the grid; with the largest
candidate omitted it is profiles3_groups3, as recorded in the columns
stable and note. Along the number of group
classes with four profiles, the knee is profiles4_groups2.
The criterion across all candidates simultaneously, expressed as the distance of each from the minimum:
plot_selection(models, what = "heatmap")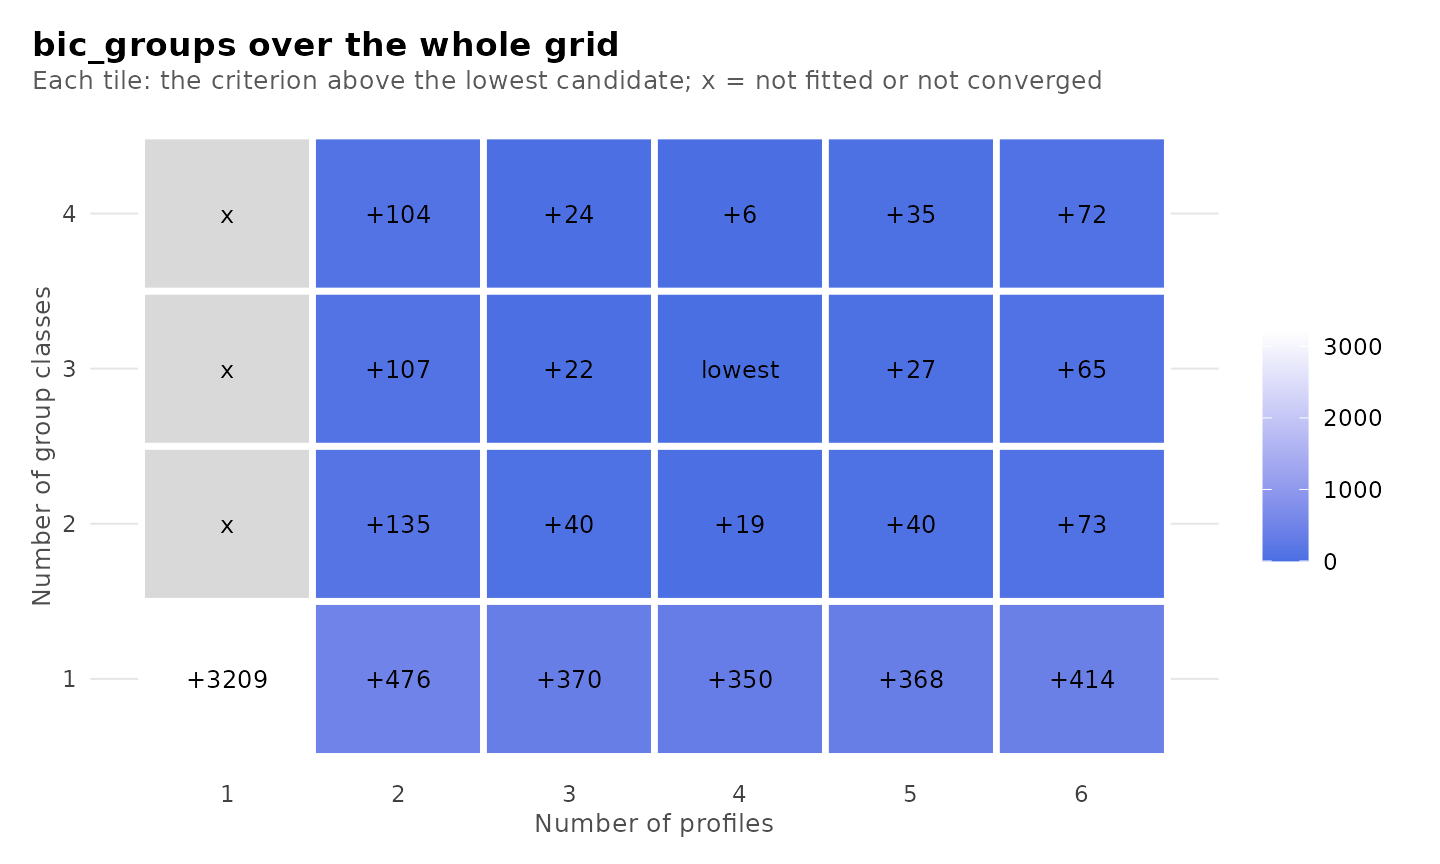
Classification quality
Each observation has a posterior probability of membership in each
class. Relative entropy (Ramaswamy et al., 1993) summarizes these
probabilities over all observations; it equals 0 when every observation
is equally likely to belong to every class and 1 when every observation
is assigned to one class with certainty. The average posterior
probability (AvePP) of a class is the mean posterior probability of that
class among the observations modally assigned to it (Nagin, 2005).
Values of at least 0.7 to 0.8 are conventionally regarded as indicating
adequate separation. The table of candidates reports the minimum,
maximum and mean AvePP at each level and the number of classes below a
cutoff, 0.8 by default, which is set with cutoff.
plot_selection(models, what = "diagnostics")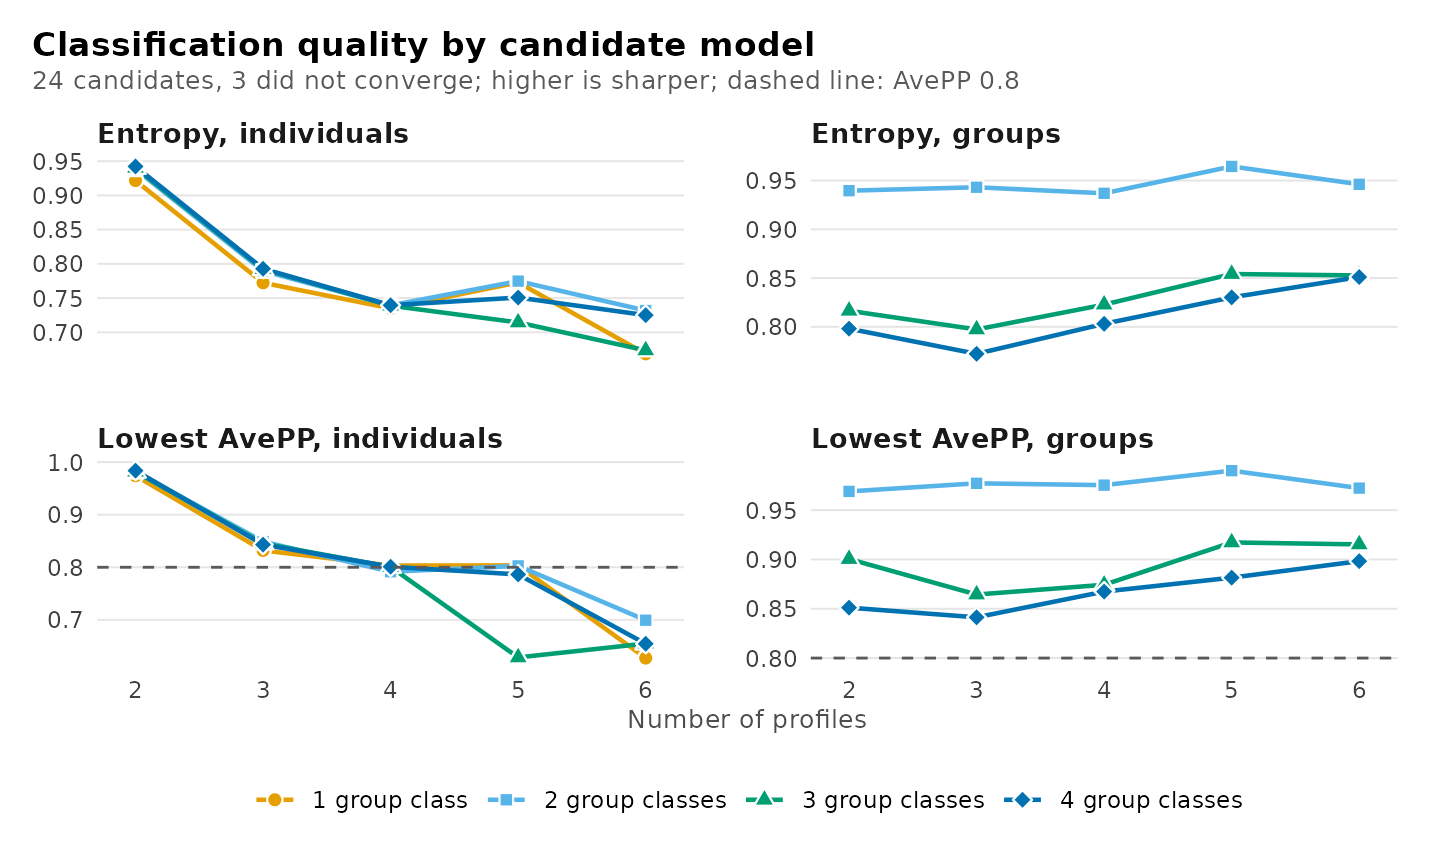
The AvePP of every class of every candidate, together with its size and the relative entropy of its level:
get_results(models, "classification")
#> candidate n_profiles n_group_classes model level class n_modal proportion_modal
#> 1 profiles2_groups1 2 1 VVI individuals 1 833 0.58579
#> 2 profiles2_groups1 2 1 VVI individuals 2 589 0.41421
#> 3 profiles3_groups1 3 1 VVI individuals 1 452 0.31786
#> 4 profiles3_groups1 3 1 VVI individuals 2 555 0.39030
#> 5 profiles3_groups1 3 1 VVI individuals 3 415 0.29184
#> 6 profiles4_groups1 4 1 VVI individuals 1 481 0.33826
#> 7 profiles4_groups1 4 1 VVI individuals 2 157 0.11041
#> 8 profiles4_groups1 4 1 VVI individuals 3 419 0.29466
#> 9 profiles4_groups1 4 1 VVI individuals 4 365 0.25668
#> 10 profiles5_groups1 5 1 VVI individuals 1 355 0.24965
#> 11 profiles5_groups1 5 1 VVI individuals 2 419 0.29466
#> 12 profiles5_groups1 5 1 VVI individuals 3 486 0.34177
#> 13 profiles5_groups1 5 1 VVI individuals 4 5 0.00352
#> 14 profiles5_groups1 5 1 VVI individuals 5 157 0.11041
#> 15 profiles6_groups1 6 1 VVI individuals 1 372 0.26160
#> 16 profiles6_groups1 6 1 VVI individuals 2 157 0.11041
#> 17 profiles6_groups1 6 1 VVI individuals 3 378 0.26582
#> 18 profiles6_groups1 6 1 VVI individuals 4 62 0.04360
#> 19 profiles6_groups1 6 1 VVI individuals 5 337 0.23699
#> 20 profiles6_groups1 6 1 VVI individuals 6 116 0.08158
#> 21 profiles2_groups2 2 2 VVI individuals 1 836 0.58790
#> 22 profiles2_groups2 2 2 VVI individuals 2 586 0.41210
#> 23 profiles2_groups2 2 2 VVI groups 1 71 0.66981
#> 24 profiles2_groups2 2 2 VVI groups 2 35 0.33019
#> 25 profiles3_groups2 3 2 VVI individuals 1 472 0.33193
#> 26 profiles3_groups2 3 2 VVI individuals 2 570 0.40084
#> 27 profiles3_groups2 3 2 VVI individuals 3 380 0.26723
#> 28 profiles3_groups2 3 2 VVI groups 1 71 0.66981
#> 29 profiles3_groups2 3 2 VVI groups 2 35 0.33019
#> 30 profiles4_groups2 4 2 VVI individuals 1 490 0.34459
#> 31 profiles4_groups2 4 2 VVI individuals 2 166 0.11674
#> 32 profiles4_groups2 4 2 VVI individuals 3 418 0.29395
#> 33 profiles4_groups2 4 2 VVI individuals 4 348 0.24473
#> 34 profiles4_groups2 4 2 VVI groups 1 71 0.66981
#> 35 profiles4_groups2 4 2 VVI groups 2 35 0.33019
#> 36 profiles5_groups2 5 2 VVI individuals 1 483 0.33966
#> 37 profiles5_groups2 5 2 VVI individuals 2 423 0.29747
#> 38 profiles5_groups2 5 2 VVI individuals 3 31 0.02180
#> 39 profiles5_groups2 5 2 VVI individuals 4 327 0.22996
#> 40 profiles5_groups2 5 2 VVI individuals 5 158 0.11111
#> 41 profiles5_groups2 5 2 VVI groups 1 72 0.67925
#> 42 profiles5_groups2 5 2 VVI groups 2 34 0.32075
#> 43 profiles6_groups2 6 2 VVI individuals 1 465 0.32700
#> 44 profiles6_groups2 6 2 VVI individuals 2 171 0.12025
#> 45 profiles6_groups2 6 2 VVI individuals 3 317 0.22293
#> 46 profiles6_groups2 6 2 VVI individuals 4 90 0.06329
#> 47 profiles6_groups2 6 2 VVI individuals 5 343 0.24121
#> 48 profiles6_groups2 6 2 VVI individuals 6 36 0.02532
#> 49 profiles6_groups2 6 2 VVI groups 1 69 0.65094
#> 50 profiles6_groups2 6 2 VVI groups 2 37 0.34906
#> 51 profiles2_groups3 2 3 VVI individuals 1 832 0.58509
#> 52 profiles2_groups3 2 3 VVI individuals 2 590 0.41491
#> 53 profiles2_groups3 2 3 VVI groups 1 25 0.23585
#> 54 profiles2_groups3 2 3 VVI groups 2 31 0.29245
#> 55 profiles2_groups3 2 3 VVI groups 3 50 0.47170
#> 56 profiles3_groups3 3 3 VVI individuals 1 367 0.25809
#> 57 profiles3_groups3 3 3 VVI individuals 2 576 0.40506
#> 58 profiles3_groups3 3 3 VVI individuals 3 479 0.33685
#> 59 profiles3_groups3 3 3 VVI groups 1 25 0.23585
#> 60 profiles3_groups3 3 3 VVI groups 2 30 0.28302
#> 61 profiles3_groups3 3 3 VVI groups 3 51 0.48113
#> 62 profiles4_groups3 4 3 VVI individuals 1 508 0.35724
#> 63 profiles4_groups3 4 3 VVI individuals 2 402 0.28270
#> 64 profiles4_groups3 4 3 VVI individuals 3 192 0.13502
#> 65 profiles4_groups3 4 3 VVI individuals 4 320 0.22504
#> 66 profiles4_groups3 4 3 VVI groups 1 28 0.26415
#> 67 profiles4_groups3 4 3 VVI groups 2 48 0.45283
#> 68 profiles4_groups3 4 3 VVI groups 3 30 0.28302
#> 69 profiles5_groups3 5 3 VVI individuals 1 123 0.08650
#> 70 profiles5_groups3 5 3 VVI individuals 2 201 0.14135
#> 71 profiles5_groups3 5 3 VVI individuals 3 244 0.17159
#> 72 profiles5_groups3 5 3 VVI individuals 4 457 0.32138
#> 73 profiles5_groups3 5 3 VVI individuals 5 397 0.27918
#> 74 profiles5_groups3 5 3 VVI groups 1 27 0.25472
#> 75 profiles5_groups3 5 3 VVI groups 2 48 0.45283
#> 76 profiles5_groups3 5 3 VVI groups 3 31 0.29245
#> 77 profiles6_groups3 6 3 VVI individuals 1 206 0.14487
#> 78 profiles6_groups3 6 3 VVI individuals 2 446 0.31364
#> 79 profiles6_groups3 6 3 VVI individuals 3 322 0.22644
#> 80 profiles6_groups3 6 3 VVI individuals 4 128 0.09001
#> 81 profiles6_groups3 6 3 VVI individuals 5 168 0.11814
#> 82 profiles6_groups3 6 3 VVI individuals 6 152 0.10689
#> 83 profiles6_groups3 6 3 VVI groups 1 47 0.44340
#> 84 profiles6_groups3 6 3 VVI groups 2 32 0.30189
#> 85 profiles6_groups3 6 3 VVI groups 3 27 0.25472
#> 86 profiles2_groups4 2 4 VVI individuals 1 832 0.58509
#> 87 profiles2_groups4 2 4 VVI individuals 2 590 0.41491
#> 88 profiles2_groups4 2 4 VVI groups 1 25 0.23585
#> 89 profiles2_groups4 2 4 VVI groups 2 12 0.11321
#> 90 profiles2_groups4 2 4 VVI groups 3 22 0.20755
#> 91 profiles2_groups4 2 4 VVI groups 4 47 0.44340
#> 92 profiles3_groups4 3 4 VVI individuals 1 477 0.33544
#> 93 profiles3_groups4 3 4 VVI individuals 2 576 0.40506
#> 94 profiles3_groups4 3 4 VVI individuals 3 369 0.25949
#> 95 profiles3_groups4 3 4 VVI groups 1 46 0.43396
#> 96 profiles3_groups4 3 4 VVI groups 2 15 0.14151
#> 97 profiles3_groups4 3 4 VVI groups 3 20 0.18868
#> 98 profiles3_groups4 3 4 VVI groups 4 25 0.23585
#> 99 profiles4_groups4 4 4 VVI individuals 1 191 0.13432
#> 100 profiles4_groups4 4 4 VVI individuals 2 321 0.22574
#> 101 profiles4_groups4 4 4 VVI individuals 3 510 0.35865
#> 102 profiles4_groups4 4 4 VVI individuals 4 400 0.28129
#> 103 profiles4_groups4 4 4 VVI groups 1 46 0.43396
#> 104 profiles4_groups4 4 4 VVI groups 2 24 0.22642
#> 105 profiles4_groups4 4 4 VVI groups 3 11 0.10377
#> 106 profiles4_groups4 4 4 VVI groups 4 25 0.23585
#> 107 profiles5_groups4 5 4 VVI individuals 1 189 0.13291
#> 108 profiles5_groups4 5 4 VVI individuals 2 38 0.02672
#> 109 profiles5_groups4 5 4 VVI individuals 3 302 0.21238
#> 110 profiles5_groups4 5 4 VVI individuals 4 491 0.34529
#> 111 profiles5_groups4 5 4 VVI individuals 5 402 0.28270
#> 112 profiles5_groups4 5 4 VVI groups 1 23 0.21698
#> 113 profiles5_groups4 5 4 VVI groups 2 25 0.23585
#> 114 profiles5_groups4 5 4 VVI groups 3 11 0.10377
#> 115 profiles5_groups4 5 4 VVI groups 4 47 0.44340
#> 116 profiles6_groups4 6 4 VVI individuals 1 491 0.34529
#> 117 profiles6_groups4 6 4 VVI individuals 2 107 0.07525
#> 118 profiles6_groups4 6 4 VVI individuals 3 341 0.23980
#> 119 profiles6_groups4 6 4 VVI individuals 4 149 0.10478
#> 120 profiles6_groups4 6 4 VVI individuals 5 174 0.12236
#> 121 profiles6_groups4 6 4 VVI individuals 6 160 0.11252
#> 122 profiles6_groups4 6 4 VVI groups 1 26 0.24528
#> 123 profiles6_groups4 6 4 VVI groups 2 14 0.13208
#> 124 profiles6_groups4 6 4 VVI groups 3 23 0.21698
#> 125 profiles6_groups4 6 4 VVI groups 4 43 0.40566
#> estimated_n estimated_proportion average_posterior odds_correct_classification relative_entropy
#> 1 832.92 0.58574 0.982 37.75 0.922
#> 2 589.08 0.41426 0.974 53.24 0.922
#> 3 452.67 0.31834 0.832 10.61 0.772
#> 4 551.11 0.38756 0.964 42.39 0.772
#> 5 418.21 0.29410 0.863 15.17 0.772
#> 6 478.06 0.33619 0.842 10.51 0.735
#> 7 172.20 0.12110 0.803 29.63 0.735
#> 8 405.28 0.28501 0.849 14.14 0.735
#> 9 366.46 0.25771 0.846 15.86 0.735
#> 10 359.22 0.25262 0.847 16.42 0.773
#> 11 405.22 0.28496 0.849 14.13 0.773
#> 12 480.38 0.33782 0.842 10.42 0.773
#> 13 4.89 0.00344 0.962 7368.14 0.773
#> 14 172.30 0.12116 0.804 29.66 0.773
#> 15 340.87 0.23971 0.735 8.78 0.669
#> 16 165.78 0.11658 0.784 27.56 0.669
#> 17 348.85 0.24532 0.780 10.89 0.669
#> 18 95.07 0.06686 0.636 24.43 0.669
#> 19 321.57 0.22614 0.812 14.74 0.669
#> 20 149.86 0.10538 0.627 14.29 0.669
#> 21 834.10 0.58657 0.985 46.08 0.938
#> 22 587.90 0.41343 0.982 76.35 0.938
#> 23 71.52 0.67470 0.992 59.89 0.940
#> 24 34.48 0.32530 0.969 64.80 0.940
#> 25 469.56 0.33021 0.849 11.40 0.790
#> 26 569.85 0.40074 0.979 68.94 0.790
#> 27 382.59 0.26905 0.850 15.45 0.790
#> 28 71.25 0.67213 0.992 62.14 0.943
#> 29 34.75 0.32787 0.977 87.77 0.943
#> 30 480.19 0.33769 0.845 10.71 0.739
#> 31 178.19 0.12531 0.791 26.49 0.739
#> 32 407.65 0.28667 0.858 15.08 0.739
#> 33 355.96 0.25033 0.846 16.41 0.739
#> 34 71.16 0.67132 0.990 48.96 0.937
#> 35 34.84 0.32868 0.975 80.76 0.937
#> 36 464.18 0.32643 0.846 11.33 0.775
#> 37 408.11 0.28700 0.860 15.27 0.775
#> 38 36.89 0.02594 0.838 194.58 0.775
#> 39 337.67 0.23746 0.848 17.88 0.775
#> 40 175.15 0.12317 0.803 28.94 0.775
#> 41 71.40 0.67360 0.990 48.07 0.965
#> 42 34.60 0.32640 0.996 581.20 0.965
#> 43 444.31 0.31245 0.835 11.14 0.732
#> 44 173.96 0.12233 0.781 25.62 0.732
#> 45 294.72 0.20726 0.728 10.24 0.732
#> 46 118.27 0.08317 0.699 25.64 0.732
#> 47 349.82 0.24600 0.845 16.71 0.732
#> 48 40.93 0.02878 0.789 126.37 0.732
#> 49 69.10 0.65185 0.987 39.18 0.946
#> 50 36.90 0.34815 0.972 65.76 0.946
#> 51 830.91 0.58433 0.986 49.28 0.940
#> 52 591.09 0.41567 0.982 75.73 0.940
#> 53 26.66 0.25147 0.905 28.33 0.816
#> 54 30.78 0.29035 0.962 62.25 0.816
#> 55 48.57 0.45818 0.900 10.69 0.816
#> 56 368.95 0.25946 0.845 15.58 0.792
#> 57 574.96 0.40433 0.978 65.03 0.792
#> 58 478.08 0.33621 0.853 11.45 0.792
#> 59 27.65 0.26086 0.898 24.87 0.797
#> 60 31.03 0.29271 0.977 104.20 0.797
#> 61 47.32 0.44643 0.864 7.90 0.797
#> 62 497.03 0.34953 0.854 10.86 0.739
#> 63 391.99 0.27566 0.847 14.60 0.739
#> 64 202.20 0.14220 0.801 24.24 0.739
#> 65 330.78 0.23261 0.842 17.57 0.739
#> 66 27.40 0.25844 0.874 19.96 0.823
#> 67 48.01 0.45292 0.915 13.01 0.823
#> 68 30.60 0.28864 0.981 127.50 0.823
#> 69 141.26 0.09934 0.628 15.34 0.714
#> 70 211.64 0.14884 0.804 23.52 0.714
#> 71 248.08 0.17446 0.804 19.44 0.714
#> 72 435.18 0.30603 0.817 10.09 0.714
#> 73 385.84 0.27134 0.843 14.42 0.714
#> 74 28.08 0.26491 0.917 30.75 0.854
#> 75 46.73 0.44081 0.918 14.29 0.854
#> 76 31.19 0.29428 0.987 180.98 0.854
#> 77 206.70 0.14536 0.777 20.53 0.674
#> 78 414.48 0.29148 0.795 9.42 0.674
#> 79 297.05 0.20890 0.733 10.42 0.674
#> 80 150.21 0.10563 0.711 20.85 0.674
#> 81 191.71 0.13482 0.655 12.18 0.674
#> 82 161.85 0.11382 0.788 28.90 0.674
#> 83 46.26 0.43639 0.925 15.84 0.853
#> 84 32.68 0.30828 0.984 137.98 0.853
#> 85 27.07 0.25534 0.915 31.49 0.853
#> 86 829.91 0.58362 0.986 50.18 0.942
#> 87 592.09 0.41638 0.984 85.01 0.942
#> 88 24.59 0.23201 0.868 21.73 0.798
#> 89 11.33 0.10689 0.851 47.77 0.798
#> 90 22.34 0.21071 0.877 26.81 0.798
#> 91 47.74 0.45039 0.912 12.62 0.798
#> 92 476.54 0.33512 0.853 11.52 0.793
#> 93 576.30 0.40527 0.980 70.36 0.793
#> 94 369.16 0.25960 0.843 15.32 0.793
#> 95 47.04 0.44379 0.902 11.51 0.772
#> 96 13.62 0.12851 0.841 35.95 0.772
#> 97 20.96 0.19774 0.868 26.74 0.772
#> 98 24.37 0.22995 0.843 17.98 0.772
#> 99 201.57 0.14175 0.801 24.37 0.740
#> 100 332.98 0.23416 0.843 17.58 0.740
#> 101 494.01 0.34741 0.850 10.64 0.740
#> 102 393.44 0.27668 0.853 15.17 0.740
#> 103 46.89 0.44232 0.903 11.76 0.803
#> 104 22.90 0.21605 0.867 23.74 0.803
#> 105 10.91 0.10288 0.898 76.55 0.803
#> 106 25.31 0.23874 0.873 21.82 0.803
#> 107 201.07 0.14140 0.803 24.79 0.751
#> 108 61.45 0.04322 0.786 81.48 0.751
#> 109 305.33 0.21472 0.831 17.96 0.751
#> 110 461.34 0.32443 0.826 9.90 0.751
#> 111 392.80 0.27623 0.853 15.15 0.751
#> 112 23.02 0.21714 0.926 44.87 0.830
#> 113 25.69 0.24237 0.882 23.26 0.830
#> 114 11.14 0.10505 0.899 75.62 0.830
#> 115 46.16 0.43544 0.909 12.98 0.830
#> 116 466.75 0.32823 0.830 9.98 0.725
#> 117 114.80 0.08073 0.847 63.10 0.725
#> 118 320.60 0.22546 0.806 14.24 0.725
#> 119 167.55 0.11783 0.765 24.39 0.725
#> 120 192.57 0.13542 0.797 25.09 0.725
#> 121 159.73 0.11233 0.654 14.97 0.725
#> 122 25.05 0.23630 0.898 28.53 0.851
#> 123 13.24 0.12488 0.907 68.41 0.851
#> 124 23.33 0.22010 0.919 40.18 0.851
#> 125 44.38 0.41872 0.940 21.71 0.851For profiles4_groups3, the relative entropy is 0.74 for the profiles and 0.82 for the group classes; the minimum AvePP is 0.8 among the profiles and 0.87 among the group classes.
Diagnostics of the estimation
A maximum reached from several random starts is more credible than one reached once, since a single start may terminate at a local maximum. An estimate on the boundary of the parameter space, such as a variance at its lower bound, indicates a model too complex for the data, and a class containing a very small proportion of the observations is difficult to interpret and to replicate. The following plots report these diagnostics for every candidate.
plot_selection(models, what = "trust")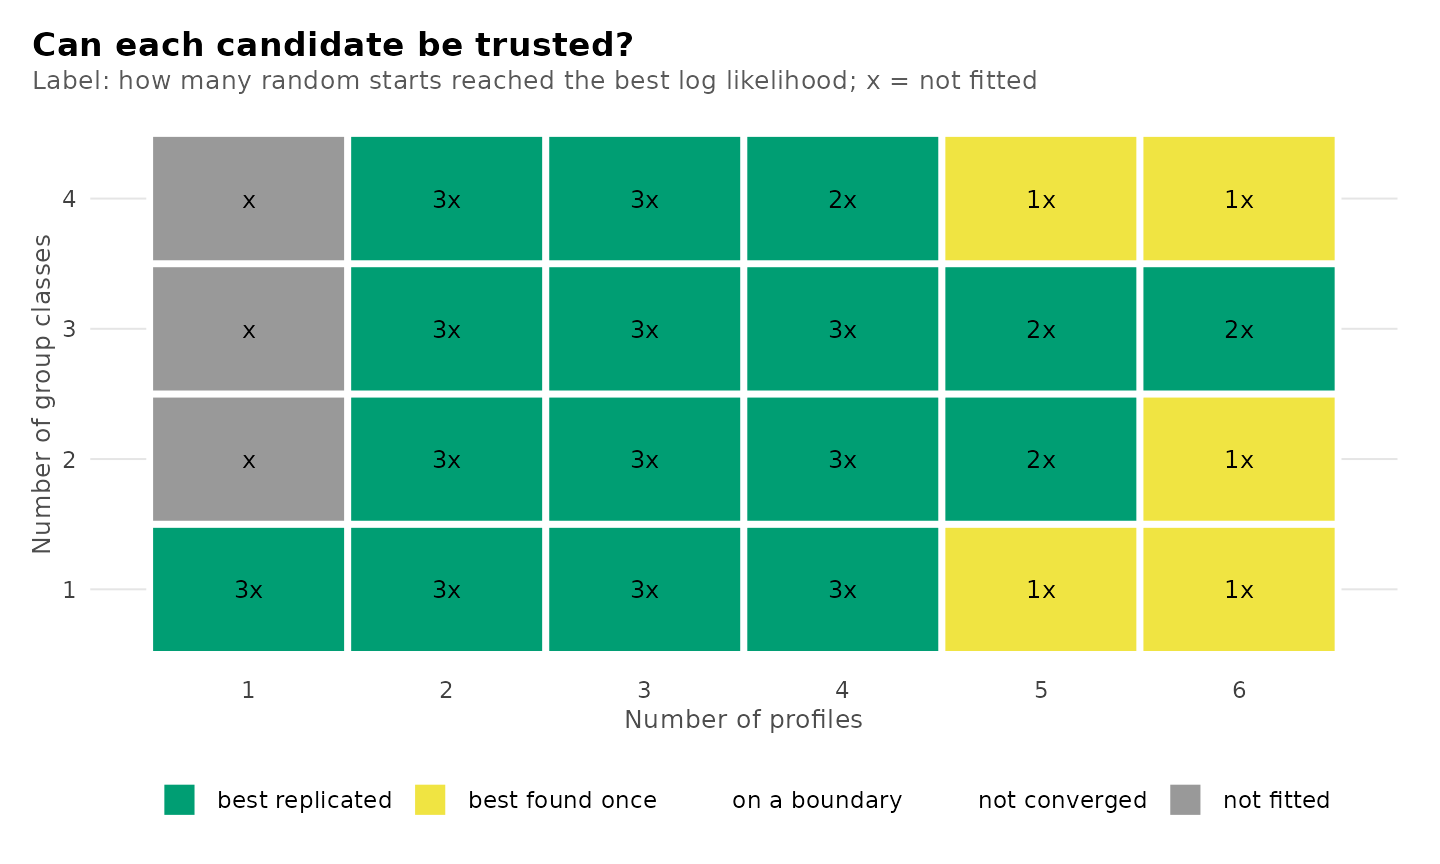
plot_selection(models, what = "smallest")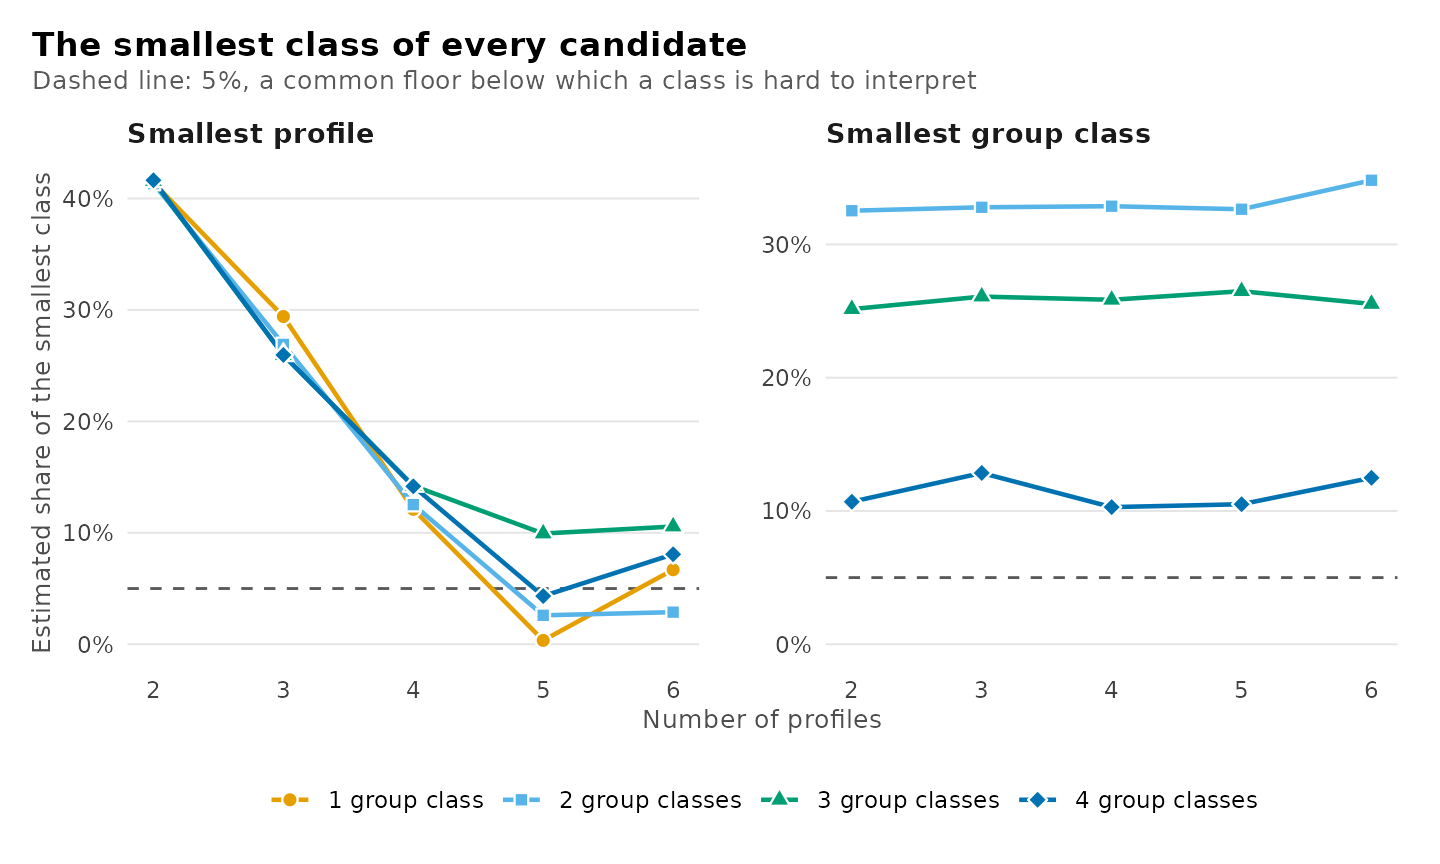
plot_selection(models) displays all plots relevant to
the choice of the number of classes jointly.
A candidate on a boundary whose smallest profile holds about one
observation is a degenerate solution, not a profile: a Gaussian profile
centred on one observation raises the likelihood without limit as its
variances shrink, so the reported likelihood is fixed by
min_variance. The default, boundary = "allow",
reports it, as Mplus does, with a warning.
boundary = "exclude" retains for each candidate the best
start with no variance at its lower bound, and is advisable when many
starts are used, since each additional start increases the chance of
reaching such a solution. Categorical indicators are unaffected.
models <- enumerate_classes(course_engagement, activity, "student",
                            n_profiles = 1:5, n_group_classes = 1:3,
                            model = "VVI", n_starts = 200,
                            boundary = "exclude", seed = 1)
Comparing candidates
compare_models() tabulates selected candidates side by
side. Candidates are specified by name, by their numbers of classes, or
by a number of profiles or group classes. The comparison adds the
difference in BIC from the minimum among the compared candidates and the
BIC weight, exp(-delta_bic / 2) normalized to sum to one,
which approximates the posterior probability of each candidate under
equal prior probabilities (Wagenmakers and Farrell, 2004).
The candidates preferred by BIC, ICL and AWE with students as the units:
compare_models(models, bic_groups_pick, icl_groups_pick, awe_groups_pick)
#> Model comparison
#>
#> Model              Profiles  Group classes   k    LogLik       BIC   ΔBIC  Weight       ICL  Entropy  Min AvePP  < 0.8  Group entropy  Group min AvePP
#> -----------------  --------  -------------  --  --------  --------  -----  ------  --------  -------  ---------  -----  -------------  ---------------
#> profiles4_groups3         4              3  51  -8307.15  16852.14   0.00   1.000  18014.13     0.74       0.80      0           0.82             0.87
#> profiles4_groups2         4              2  47  -8326.19  16871.57  19.43   0.000  18021.23     0.74       0.79      1           0.94             0.98
#> profiles3_groups2         3              2  35  -8364.52  16892.26  40.12   0.000  17640.46     0.79       0.85      0           0.94             0.98
The same candidates specified by their numbers of classes, with labels:
compare_models(models, bic = c(4, 3), icl = c(4, 2), awe = c(3, 2))
#> Model comparison
#>
#> Model  Profiles  Group classes   k    LogLik       BIC   ΔBIC  Weight       ICL  Entropy  Min AvePP  < 0.8  Group entropy  Group min AvePP
#> -----  --------  -------------  --  --------  --------  -----  ------  --------  -------  ---------  -----  -------------  ---------------
#> bic           4              3  51  -8307.15  16852.14   0.00   1.000  18014.13     0.74       0.80      0           0.82             0.87
#> icl           4              2  47  -8326.19  16871.57  19.43   0.000  18021.23     0.74       0.79      1           0.94             0.98
#> awe           3              2  35  -8364.52  16892.26  40.12   0.000  17640.46     0.79       0.85      0           0.94             0.98
All candidates with four profiles, which isolates the contribution of the group classes:
comparison <- compare_models(models, n_profiles = 4)
comparison
#> Model comparison
#>
#> Model              Profiles  Group classes   k    LogLik       BIC    ΔBIC  Weight       ICL  Entropy  Min AvePP  < 0.8  Group entropy  Group min AvePP
#> -----------------  --------  -------------  --  --------  --------  ------  ------  --------  -------  ---------  -----  -------------  ---------------
#> profiles4_groups1         4              1  43  -8501.00  17202.53  350.38   0.000  18358.86     0.74       0.80      0
#> profiles4_groups2         4              2  47  -8326.19  16871.57   19.43   0.000  18021.23     0.74       0.79      1           0.94             0.98
#> profiles4_groups3         4              3  51  -8307.15  16852.14    0.00   0.941  18014.13     0.74       0.80      0           0.82             0.87
#> profiles4_groups4         4              4  55  -8300.60  16857.69    5.54   0.059  18027.32     0.74       0.80      0           0.80             0.87
plot(comparison)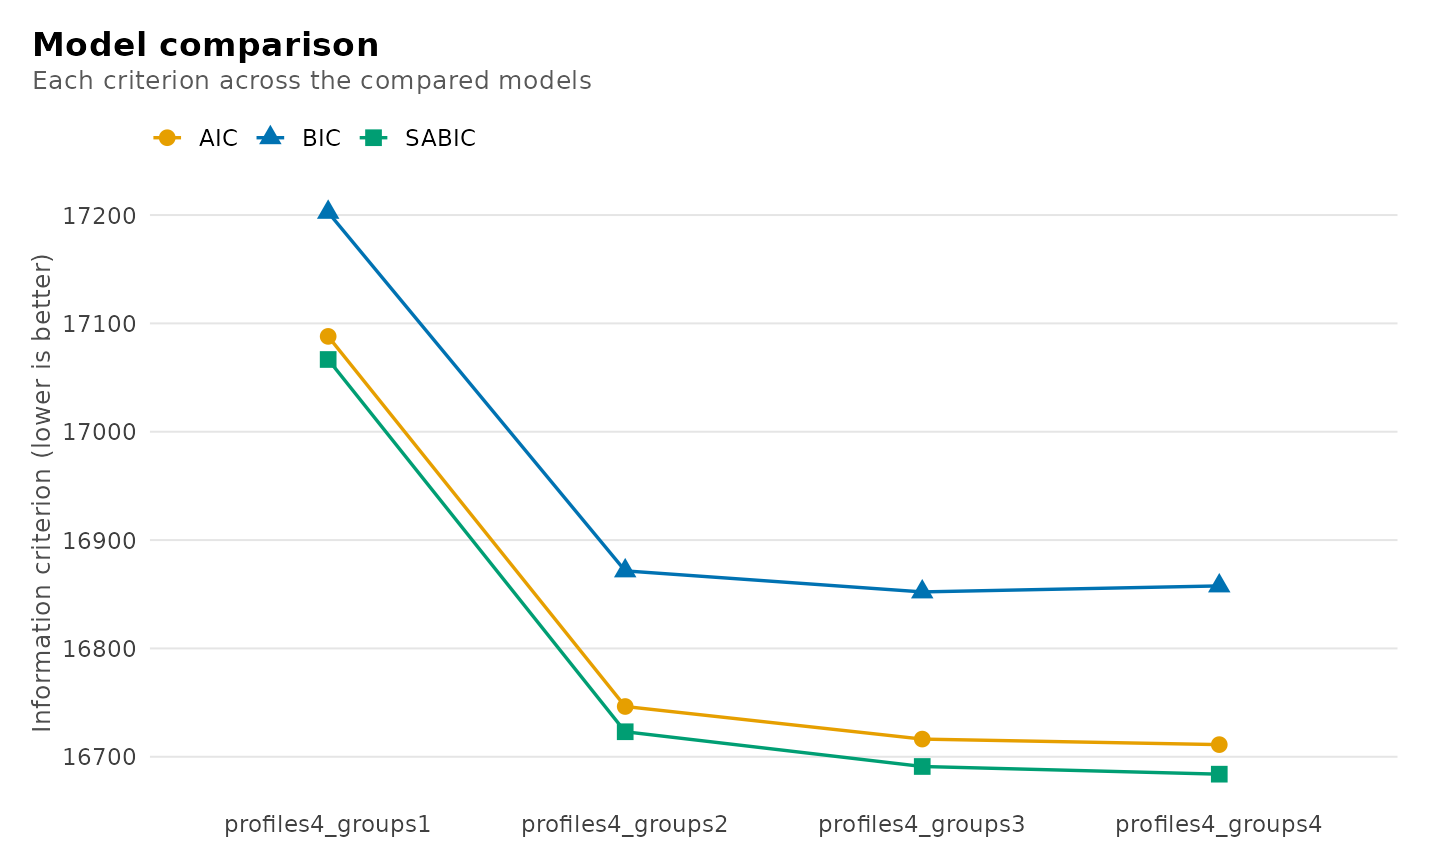
The comparison retains the fitted models. get_results()
returns the AvePP of every class of every compared model, and
get_candidate() the model underlying a row.
get_results(comparison, "classification")
#>                model       level class n_modal proportion_modal estimated_n estimated_proportion
#> 1  profiles4_groups1 individuals     1     481            0.338       478.1                0.336
#> 2  profiles4_groups1 individuals     2     157            0.110       172.2                0.121
#> 3  profiles4_groups1 individuals     3     419            0.295       405.3                0.285
#> 4  profiles4_groups1 individuals     4     365            0.257       366.5                0.258
#> 5  profiles4_groups2 individuals     1     490            0.345       480.2                0.338
#> 6  profiles4_groups2 individuals     2     166            0.117       178.2                0.125
#> 7  profiles4_groups2 individuals     3     418            0.294       407.6                0.287
#> 8  profiles4_groups2 individuals     4     348            0.245       356.0                0.250
#> 9  profiles4_groups2      groups     1      71            0.670        71.2                0.671
#> 10 profiles4_groups2      groups     2      35            0.330        34.8                0.329
#> 11 profiles4_groups3 individuals     1     508            0.357       497.0                0.350
#> 12 profiles4_groups3 individuals     2     402            0.283       392.0                0.276
#> 13 profiles4_groups3 individuals     3     192            0.135       202.2                0.142
#> 14 profiles4_groups3 individuals     4     320            0.225       330.8                0.233
#> 15 profiles4_groups3      groups     1      28            0.264        27.4                0.258
#> 16 profiles4_groups3      groups     2      48            0.453        48.0                0.453
#> 17 profiles4_groups3      groups     3      30            0.283        30.6                0.289
#> 18 profiles4_groups4 individuals     1     191            0.134       201.6                0.142
#> 19 profiles4_groups4 individuals     2     321            0.226       333.0                0.234
#> 20 profiles4_groups4 individuals     3     510            0.359       494.0                0.347
#> 21 profiles4_groups4 individuals     4     400            0.281       393.4                0.277
#> 22 profiles4_groups4      groups     1      46            0.434        46.9                0.442
#> 23 profiles4_groups4      groups     2      24            0.226        22.9                0.216
#> 24 profiles4_groups4      groups     3      11            0.104        10.9                0.103
#> 25 profiles4_groups4      groups     4      25            0.236        25.3                0.239
#>    average_posterior odds_correct_classification relative_entropy
#> 1              0.842                        10.5            0.735
#> 2              0.803                        29.6            0.735
#> 3              0.849                        14.1            0.735
#> 4              0.846                        15.9            0.735
#> 5              0.845                        10.7            0.739
#> 6              0.791                        26.5            0.739
#> 7              0.858                        15.1            0.739
#> 8              0.846                        16.4            0.739
#> 9              0.990                        49.0            0.937
#> 10             0.975                        80.8            0.937
#> 11             0.854                        10.9            0.739
#> 12             0.847                        14.6            0.739
#> 13             0.801                        24.2            0.739
#> 14             0.842                        17.6            0.739
#> 15             0.874                        20.0            0.823
#> 16             0.915                        13.0            0.823
#> 17             0.981                       127.5            0.823
#> 18             0.801                        24.4            0.740
#> 19             0.843                        17.6            0.740
#> 20             0.850                        10.6            0.740
#> 21             0.853                        15.2            0.740
#> 22             0.903                        11.8            0.803
#> 23             0.867                        23.7            0.803
#> 24             0.898                        76.5            0.803
#> 25             0.873                        21.8            0.803
Analysis of the chosen candidate
The analysis proceeds with profiles4_groups3, the candidate that
minimizes BIC with students as the units. It is extracted by name with
get_candidate(); specifying the numbers of classes, as in
get_candidate(models, 4, 3), returns the same model.
chosen <- get_candidate(models, "profiles4_groups3")
chosen
#> Two-level latent profile analysis: 4 profiles, 3 group classes
#> 1422 individuals in 106 groups; varying diagonal residual covariance (VVI)
#> Log likelihood: -8307.154320 | AIC: 16716.309 | BIC (groups): 16852.144
#> Converged: TRUE | iterations: 48 | best start: 3/3
#>
#>  profile browse lectures forum_read forum_post attendance count proportion
#>        1  0.412    0.232      0.490      0.383      0.309   497      0.350
#>        2 -0.564   -0.561     -0.695     -0.676     -0.656   392      0.276
#>        3 -1.113   -0.685     -1.200     -0.880     -1.417   202      0.142
#>        4  0.728    0.734      0.821      0.763      1.180   331      0.233
#>
#> Variances and standard errors: get_results(x, "profiles").
#> Every other table: get_results(x, what = ), or get_results(x, "all").
chosen is an object of the class returned by
multilpa(). Its summary reports the estimates with their
standard errors.
summary(chosen)
#> Two-level latent profile analysis: 4 profiles, 3 group classes
#> Individuals: 1422; groups: 106; parameters: 51; converged: TRUE
#> Log likelihood: -8307.154320; AIC: 16716.309
#> BIC (groups): 16852.144; BIC (individuals): 16984.559
#> Best likelihood replicated in 3/3 starts (absolute tolerance 0.00831).
#>
#> -- profiles --------------------------------------------------------
#> profile indicator mean variance standard_deviation mean_standard_error variance_standard_error
#> 1 browse 0.4124 0.6154 0.7845 0.04315 0.04351
#> 1 lectures 0.2325 0.7596 0.8715 0.05526 0.05724
#> 1 forum_read 0.4903 0.4509 0.6715 0.04119 0.03454
#> 1 forum_post 0.3834 0.7045 0.8394 0.05051 0.05366
#> 1 attendance 0.3092 0.1976 0.4445 0.05098 0.02208
#> 2 browse -0.5636 0.5199 0.7210 0.05555 0.04358
#> 2 lectures -0.5614 0.5498 0.7415 0.04752 0.04624
#> 2 forum_read -0.6949 0.3167 0.5627 0.04899 0.02951
#> 2 forum_post -0.6760 0.4611 0.6790 0.04605 0.04176
#> 2 attendance -0.6564 0.2567 0.5066 0.06568 0.03088
#> ... 10 more rows. get_results(x, what = "profiles")
#>
#> -- responses -------------------------------------------------------
#> (no rows)
#>
#> -- covariances -----------------------------------------------------
#> profile indicator indicator_2 covariance
#> 1 browse browse 0.6154
#> 1 lectures browse 0.0000
#> 1 forum_read browse 0.0000
#> 1 forum_post browse 0.0000
#> 1 attendance browse 0.0000
#> 1 browse lectures 0.0000
#> 1 lectures lectures 0.7596
#> 1 forum_read lectures 0.0000
#> 1 forum_post lectures 0.0000
#> 1 attendance lectures 0.0000
#> ... 90 more rows. get_results(x, what = "covariances")
#>
#> -- profile_probabilities -------------------------------------------
#> group_class profile probability group_class_probability
#> 1 1 0.60651 0.2584
#> 1 2 0.02188 0.2584
#> 1 3 0.03272 0.2584
#> 1 4 0.33890 0.2584
#> 2 1 0.39272 0.4529
#> 2 2 0.23522 0.4529
#> 2 3 0.10354 0.4529
#> 2 4 0.26852 0.4529
#> 3 1 0.05318 0.2886
#> 3 2 0.56484 0.2886
#> ... 2 more rows. get_results(x, what = "profile_probabilities")
#>
#> -- counts ----------------------------------------------------------
#> level class effective_count effective_proportion
#> individuals 1 497.03 0.3495
#> individuals 2 391.99 0.2757
#> individuals 3 202.20 0.1422
#> individuals 4 330.78 0.2326
#> groups 1 27.40 0.2584
#> groups 2 48.01 0.4529
#> groups 3 30.60 0.2886
#>
#> -- posteriors ------------------------------------------------------
#> row group profile posterior modal
#> 1 1 1 4.984e-01 FALSE
#> 2 1 1 6.732e-01 TRUE
#> 3 1 1 2.020e-06 FALSE
#> 4 1 1 1.720e-06 FALSE
#> 5 1 1 7.362e-07 FALSE
#> 6 1 1 5.209e-06 FALSE
#> 7 1 1 1.011e-05 FALSE
#> 8 1 1 8.729e-06 FALSE
#> 9 1 1 4.304e-07 FALSE
#> 10 1 1 2.373e-06 FALSE
#> ... 5678 more rows. get_results(x, what = "posteriors")
#>
#> -- group_posteriors ------------------------------------------------
#> group group_size log_likelihood group_class posterior modal
#> 1 13 -64.40 1 2.670e-12 FALSE
#> 2 13 -70.85 1 1.213e-14 FALSE
#> 3 14 -75.11 1 9.901e-01 TRUE
#> 4 13 -66.48 1 9.846e-01 TRUE
#> 5 14 -75.41 1 6.383e-13 FALSE
#> 6 12 -76.76 1 9.975e-04 FALSE
#> 7 15 -87.20 1 9.826e-01 TRUE
#> 8 14 -83.85 1 1.029e-08 FALSE
#> 9 14 -81.97 1 9.868e-01 TRUE
#> 10 15 -82.36 1 6.470e-14 FALSE
#> ... 308 more rows. get_results(x, what = "group_posteriors")
#>
#> -- assignments -----------------------------------------------------
#> student browse lectures forum_read forum_post attendance profile group_class uncertainty
#> 1 0.73 -0.08 0.30 0.67 0.72 4 3 0.5005
#> 1 0.68 0.53 -0.02 -0.55 0.70 1 3 0.3268
#> 1 -1.51 -0.51 -0.91 -0.80 -0.97 3 3 0.4740
#> 1 0.64 -1.02 -1.62 -1.20 -1.26 2 3 0.2989
#> 1 -0.94 -0.37 -0.71 -0.28 -1.52 3 3 0.3767
#> 1 -0.36 -0.46 -0.77 -0.43 -1.34 2 3 0.3609
#> 1 0.38 -1.85 -0.84 -1.09 -1.12 2 3 0.1305
#> 1 -1.44 0.66 -0.67 -1.67 -1.00 2 3 0.3803
#> 1 -0.76 -0.43 -1.04 -0.69 -1.37 3 3 0.3328
#> 1 0.26 -0.95 -0.51 -1.89 -1.45 2 3 0.2084
#> posterior_profile_1 posterior_profile_2 posterior_profile_3 posterior_profile_4
#> 4.984e-01 0.002032 3.221e-09 4.995e-01
#> 6.732e-01 0.049166 5.577e-07 2.776e-01
#> 2.020e-06 0.473969 5.260e-01 1.136e-11
#> 1.720e-06 0.701122 2.989e-01 5.710e-12
#> 7.362e-07 0.376655 6.233e-01 1.129e-12
#> 5.209e-06 0.639084 3.609e-01 2.753e-11
#> 1.011e-05 0.869464 1.305e-01 6.738e-11
#> 8.729e-06 0.619696 3.803e-01 3.884e-11
#> 4.304e-07 0.332821 6.672e-01 9.040e-13
#> 2.373e-06 0.791623 2.084e-01 1.990e-12
#> ... 1412 more rows. get_results(x, what = "assignments")
#>
#> -- classification --------------------------------------------------
#> level class n_modal proportion_modal estimated_n estimated_proportion average_posterior
#> individuals 1 508 0.3572 497.03 0.3495 0.8537
#> individuals 2 402 0.2827 391.99 0.2757 0.8475
#> individuals 3 192 0.1350 202.20 0.1422 0.8007
#> individuals 4 320 0.2250 330.78 0.2326 0.8419
#> groups 1 28 0.2642 27.40 0.2584 0.8743
#> groups 2 48 0.4528 48.01 0.4529 0.9150
#> groups 3 30 0.2830 30.60 0.2886 0.9810
#> odds_correct_classification
#> 10.86
#> 14.60
#> 24.24
#> 17.57
#> 19.96
#> 13.01
#> 127.50
#>
#> -- average_posteriors ----------------------------------------------
#> level assigned_class class n_assigned average_posterior
#> individuals 1 1 508 8.537e-01
#> individuals 1 2 508 2.566e-02
#> individuals 1 3 508 2.592e-05
#> individuals 1 4 508 1.206e-01
#> individuals 2 1 402 3.174e-02
#> individuals 2 2 402 8.475e-01
#> individuals 2 3 402 1.205e-01
#> individuals 2 4 402 2.550e-04
#> individuals 3 1 192 6.639e-06
#> individuals 3 2 192 1.993e-01
#> ... 15 more rows. get_results(x, what = "average_posteriors")
#>
#> -- classification_errors -------------------------------------------
#> level true_class assigned_class probability
#> individuals 1 1 8.726e-01
#> individuals 1 2 2.567e-02
#> individuals 1 3 2.564e-06
#> individuals 1 4 1.018e-01
#> individuals 2 1 3.325e-02
#> individuals 2 2 8.691e-01
#> individuals 2 3 9.761e-02
#> individuals 2 4 1.973e-05
#> individuals 3 1 6.511e-05
#> individuals 3 2 2.396e-01
#> ... 15 more rows. get_results(x, what = "classification_errors")
#>
#> -- bch_weights -----------------------------------------------------
#> level unit assigned_class class weight
#> individuals 1 4 1 -0.2679593
#> individuals 1 4 2 0.0077387
#> individuals 1 4 3 -0.0009927
#> individuals 1 4 4 1.2612132
#> individuals 2 1 1 1.1786556
#> individuals 2 1 2 -0.0360361
#> individuals 2 1 3 0.0046227
#> individuals 2 1 4 -0.1472422
#> individuals 3 3 1 0.0146287
#> individuals 3 3 2 -0.3764143
#> ... 5996 more rows. get_results(x, what = "bch_weights")
#>
#> -- entropy ---------------------------------------------------------
#> level n_classes n_units entropy_sum relative_entropy
#> individuals 4 1422 514.79 0.7389
#> groups 3 106 20.64 0.8228
#>
#> -- residuals -------------------------------------------------------
#> profile indicator_1 indicator_2 kind observed expected residual effective_n statistic df
#> profile_3 lectures forum_post gaussian -0.11521 0 -0.11521 202.2 -1.633 NA
#> profile_1 browse forum_post gaussian -0.10181 0 -0.10181 497.0 -2.271 NA
#> profile_2 lectures attendance gaussian 0.10068 0 0.10068 392.0 1.992 NA
#> profile_3 browse forum_post gaussian 0.09747 0 0.09747 202.2 1.380 NA
#> profile_1 lectures attendance gaussian 0.09578 0 0.09578 497.0 2.135 NA
#> profile_1 browse lectures gaussian -0.09387 0 -0.09387 497.0 -2.093 NA
#> profile_3 browse lectures gaussian -0.09310 0 -0.09310 202.2 -1.318 NA
#> profile_2 browse forum_post gaussian -0.08845 0 -0.08845 392.0 -1.749 NA
#> profile_4 browse attendance gaussian 0.08648 0 0.08648 330.8 1.570 NA
#> profile_3 lectures attendance gaussian 0.08393 0 0.08393 202.2 1.187 NA
#> p_value p_adjusted
#> 0.10240 0.10240
#> 0.02316 0.02316
#> 0.04632 0.04632
#> 0.16754 0.16754
#> 0.03272 0.03272
#> 0.03638 0.03638
#> 0.18758 0.18758
#> 0.08028 0.08028
#> 0.11651 0.11651
#> 0.23507 0.23507
#> ... 30 more rows. get_results(x, what = "residuals")
#>
#> -- information_criteria --------------------------------------------
#> log_likelihood n_parameters aic kic bic_groups bic_individual sabic_groups sabic_individual
#> -8307 51 16716 16770 16852 16985 16691 16823
#> caic_groups caic_individual awe_groups awe_individual icl_groups icl_individual clc_groups
#> 16903 17036 17284 18537 16893 18014 16656
#> clc_individual
#> 17644
#>
#> -- model -----------------------------------------------------------
#> n_observations n_informative n_groups n_profiles n_group_classes centering scaling
#> 1422 1422 106 4 3 none none
#> covariance_structure n_parameters n_parameters_with_measurement log_likelihood aic bic_groups
#> VVI 51 51 -8307 16716 16852
#> bic_individual converged iterations boundary small_classes best_start n_best_replicated weights
#> 16985 TRUE 48 FALSE FALSE 3 3 <NA>
#>
#> -- stages ----------------------------------------------------------
#> stage group_classes fixed log_likelihood parameters parameters_with_measurement converged
#> joint 3 <NA> -8307 51 51 TRUE
#>
#> -- starts ----------------------------------------------------------
#> start log_likelihood converged iterations error boundary
#> 1 -8307 TRUE 72 <NA> FALSE
#> 2 -8307 TRUE 93 <NA> FALSE
#> 3 -8307 TRUE 48 <NA> FALSE
#>
#> -- data ------------------------------------------------------------
#> student browse lectures forum_read forum_post attendance
#> 1 0.73 -0.08 0.30 0.67 0.72
#> 1 0.68 0.53 -0.02 -0.55 0.70
#> 1 -1.51 -0.51 -0.91 -0.80 -0.97
#> 1 0.64 -1.02 -1.62 -1.20 -1.26
#> 1 -0.94 -0.37 -0.71 -0.28 -1.52
#> 1 -0.36 -0.46 -0.77 -0.43 -1.34
#> 1 0.38 -1.85 -0.84 -1.09 -1.12
#> 1 -1.44 0.66 -0.67 -1.67 -1.00
#> 1 -0.76 -0.43 -1.04 -0.69 -1.37
#> 1 0.26 -0.95 -0.51 -1.89 -1.45
#> ... 1412 more rows. get_results(x, what = "data")
#>
#> 19 tables above, truncated to fit. get_results(x, what = ) returns any
#> of them whole, and get_results(x, what = "all") returns every one.The profiles are displayed as their means on the five indicators.
plot_profiles(chosen)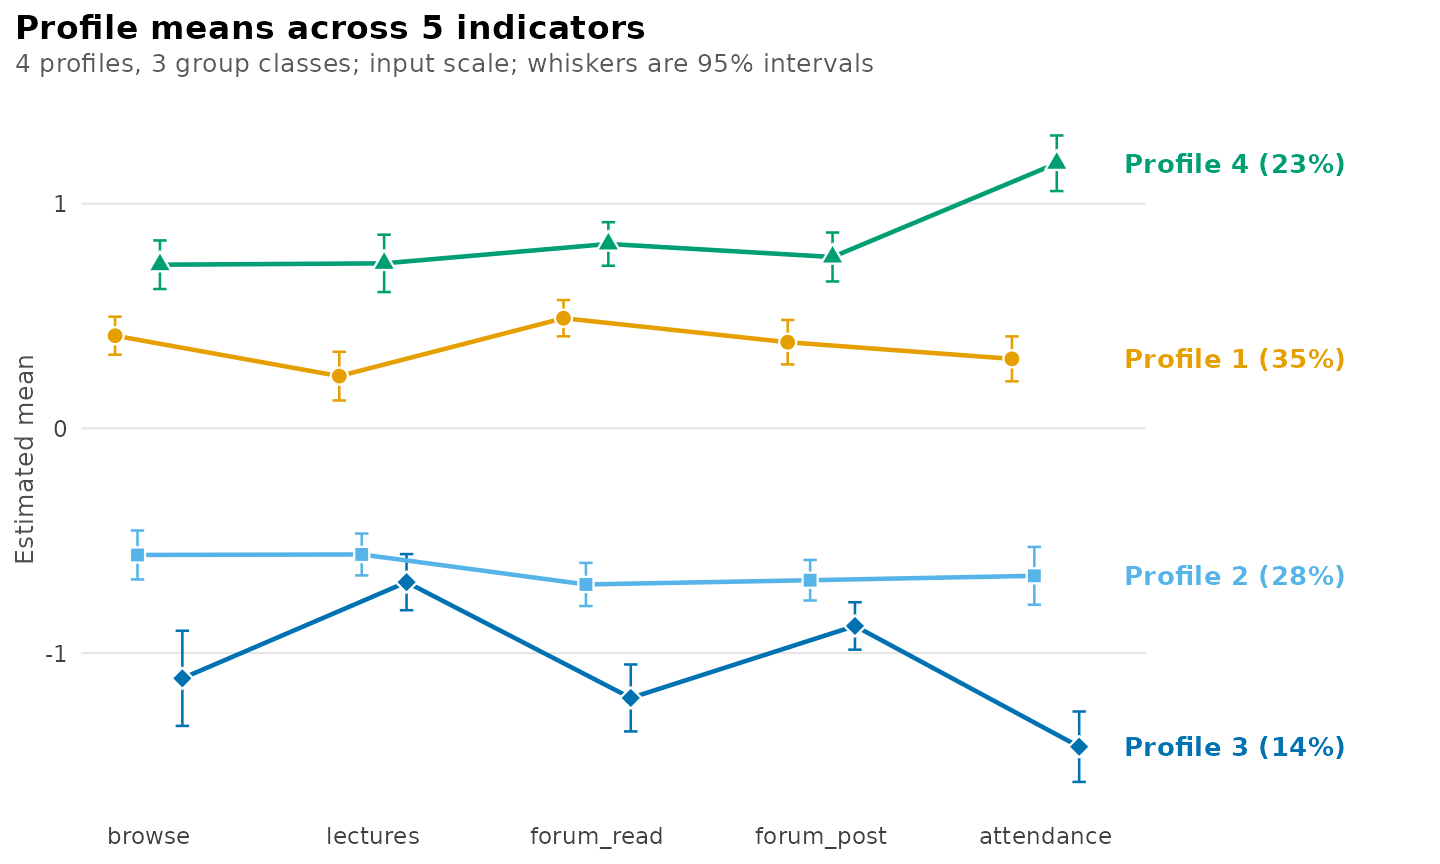
Each group class has its own distribution over the four profiles.
plot_prevalence(chosen)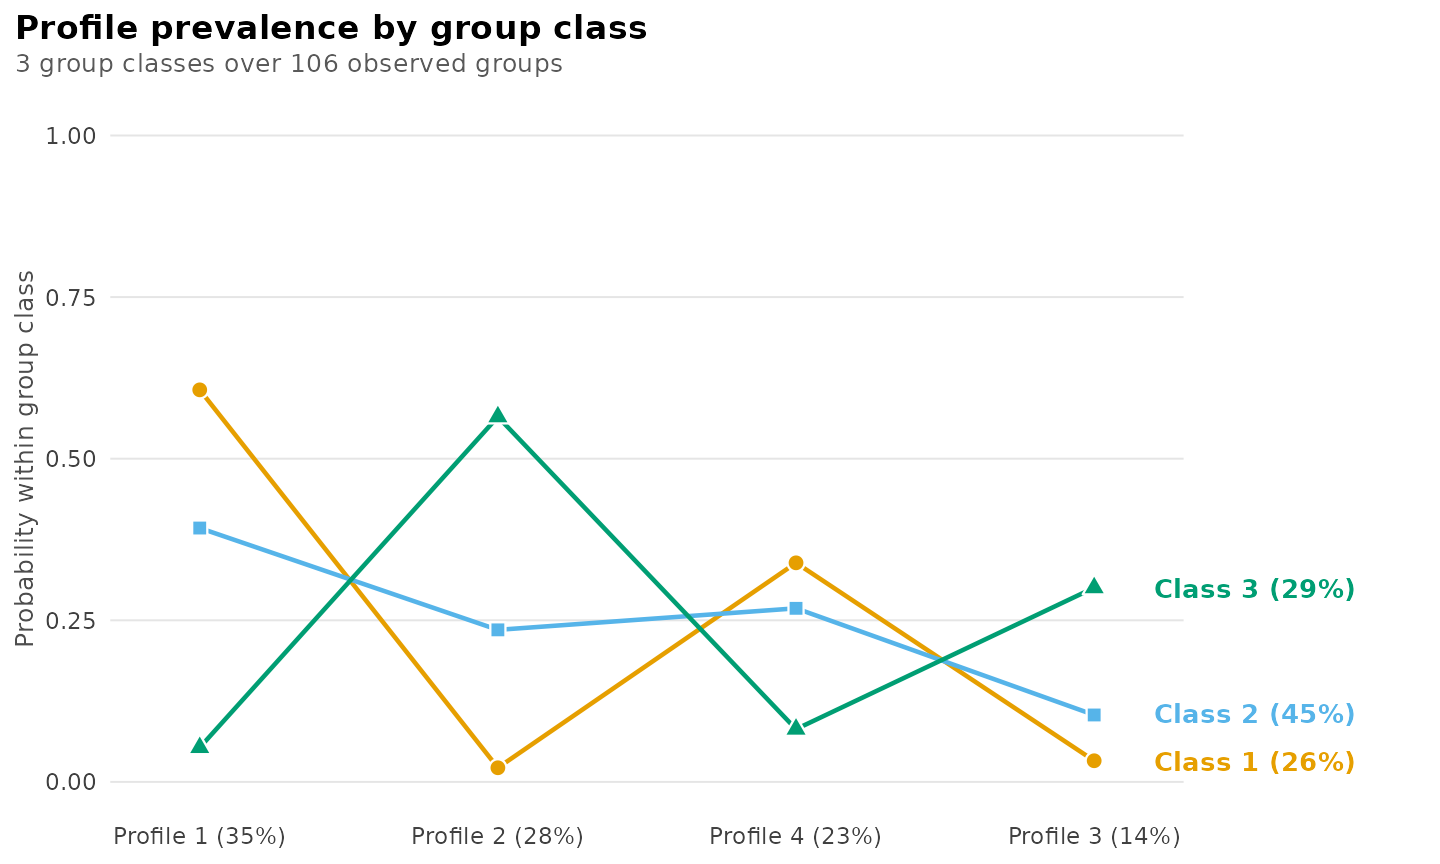
The classification diagnostics of the chosen model:
diagnostics(chosen)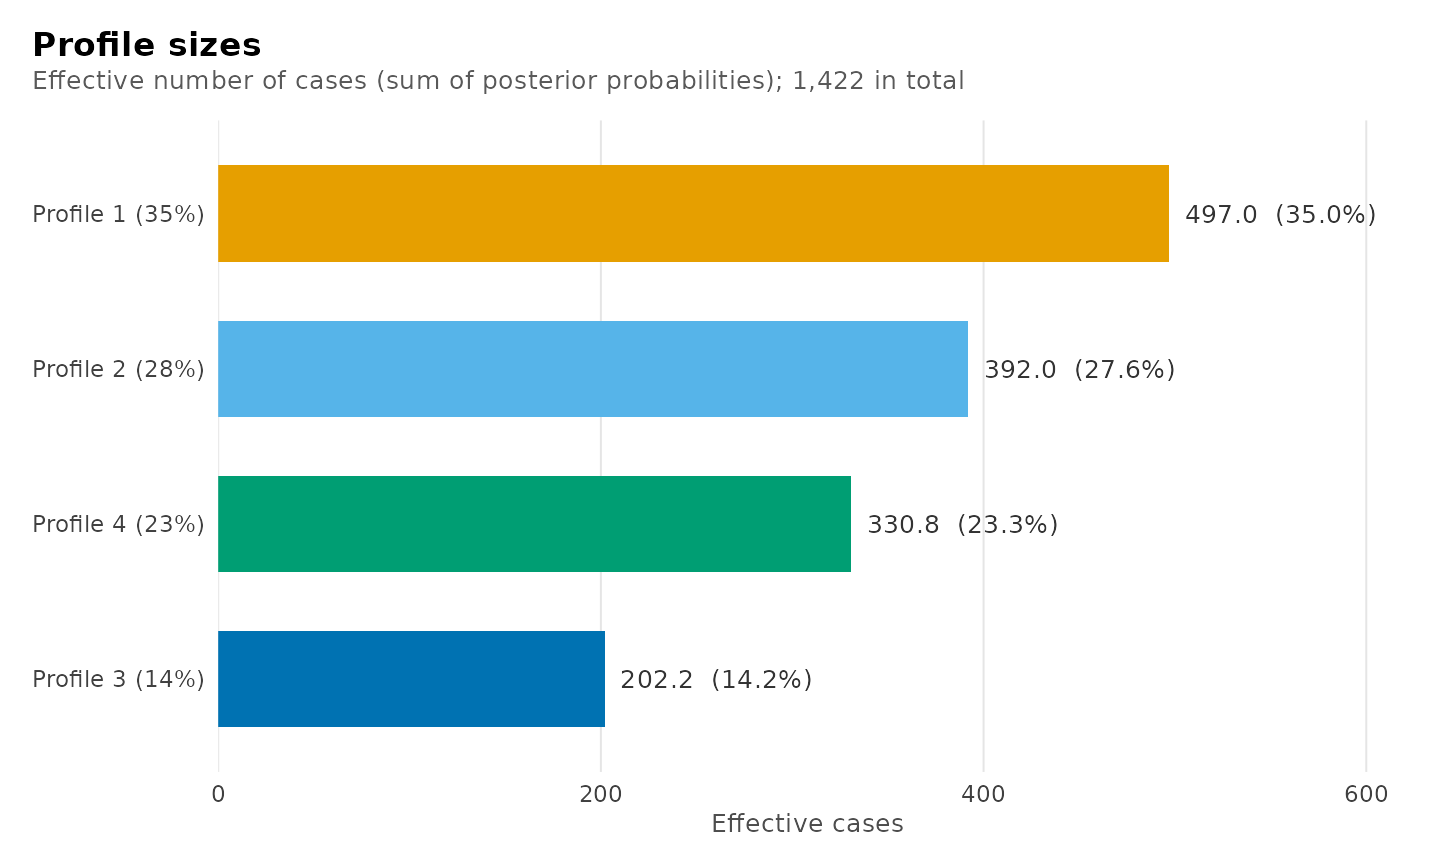
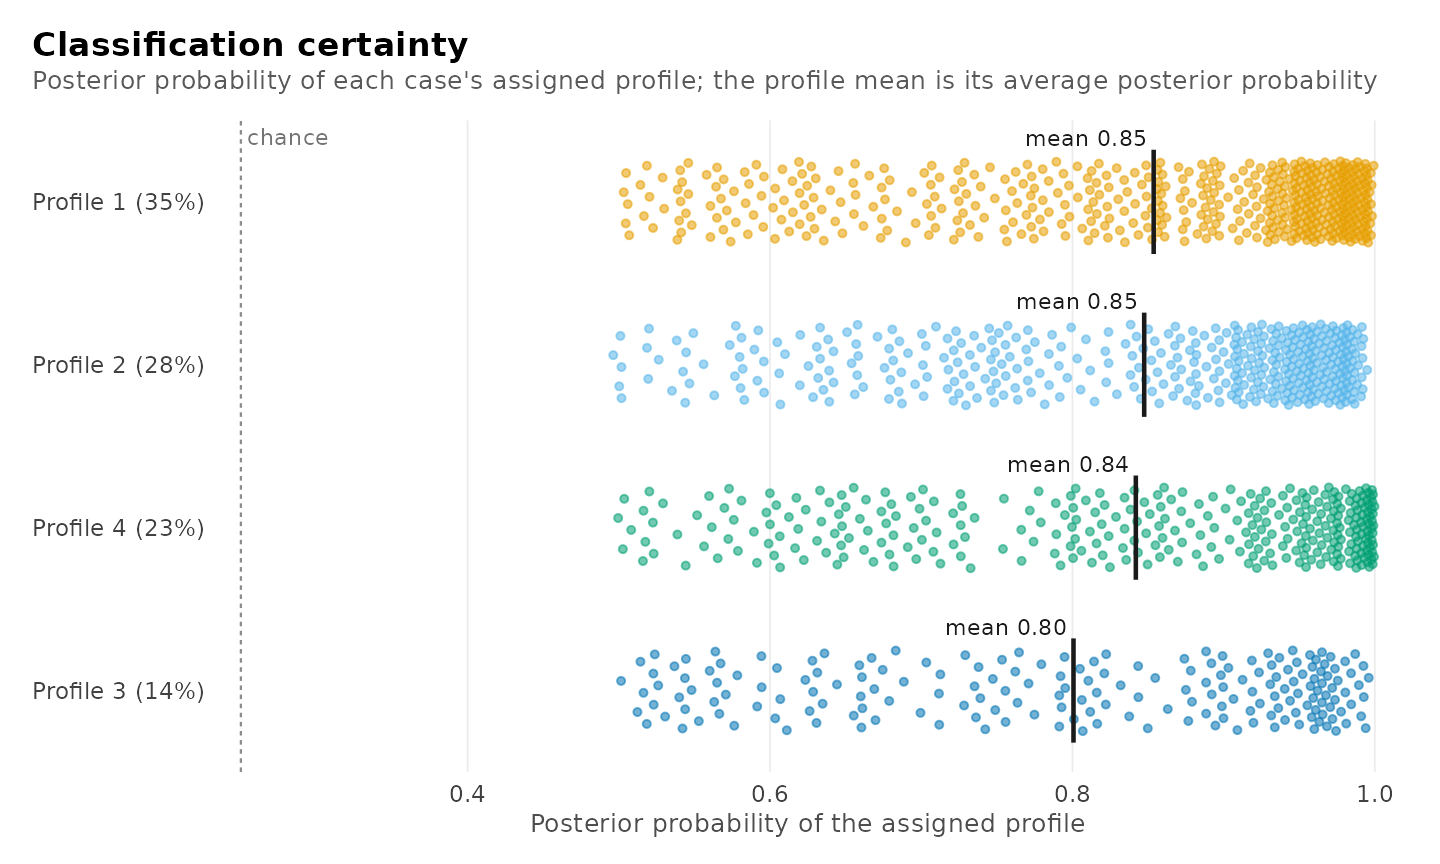
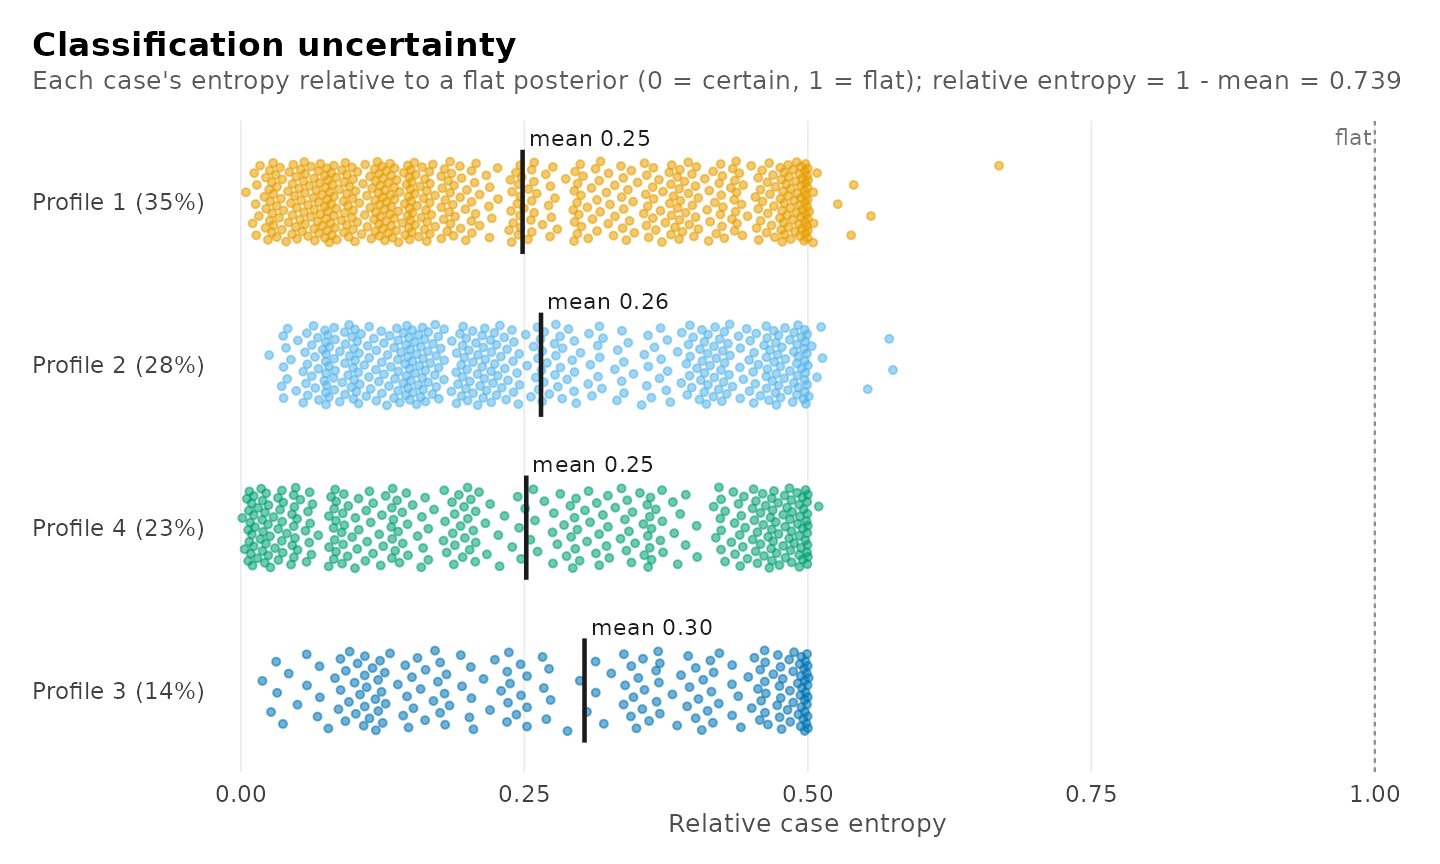
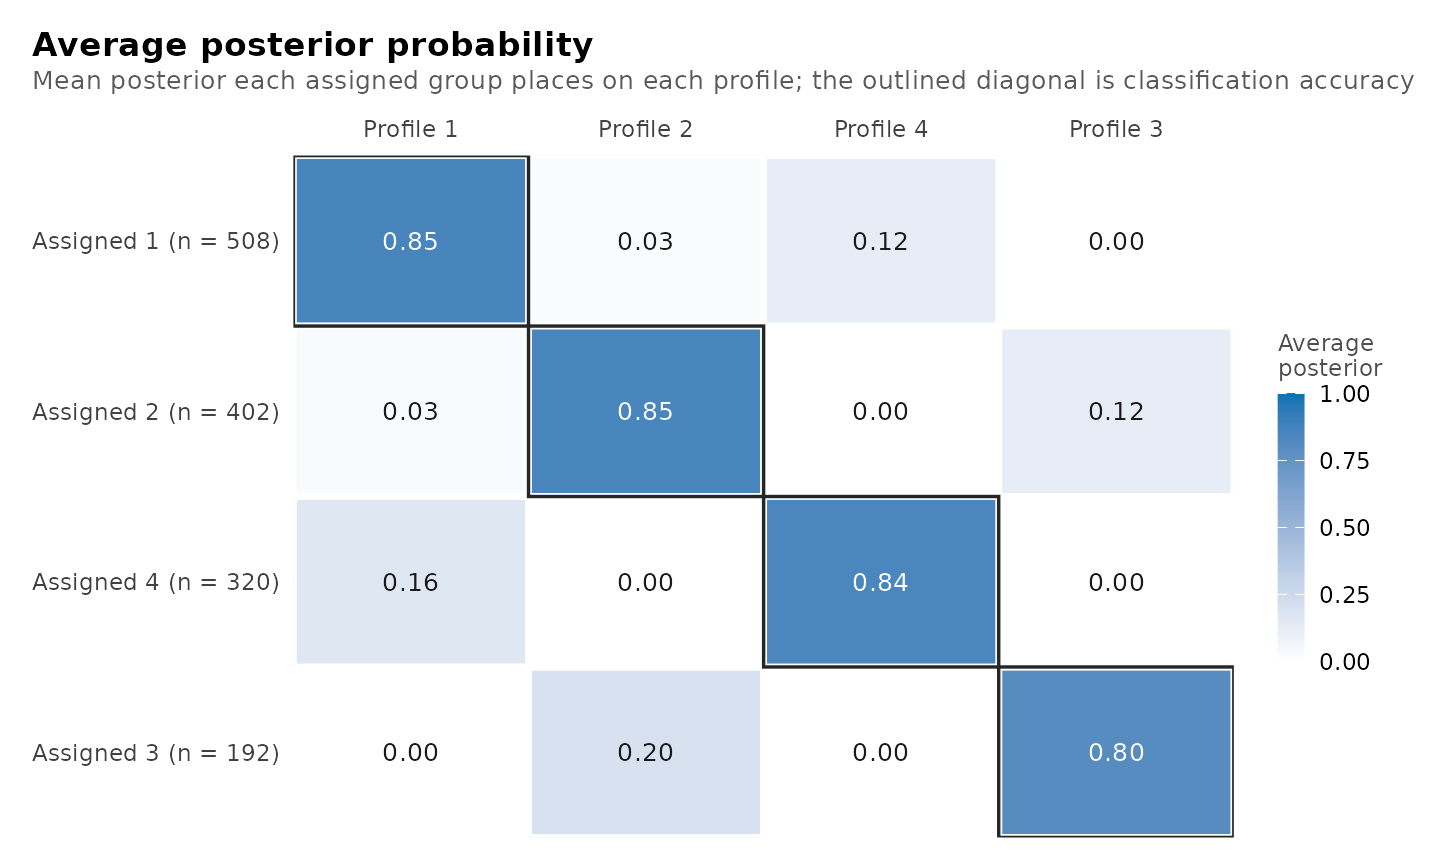
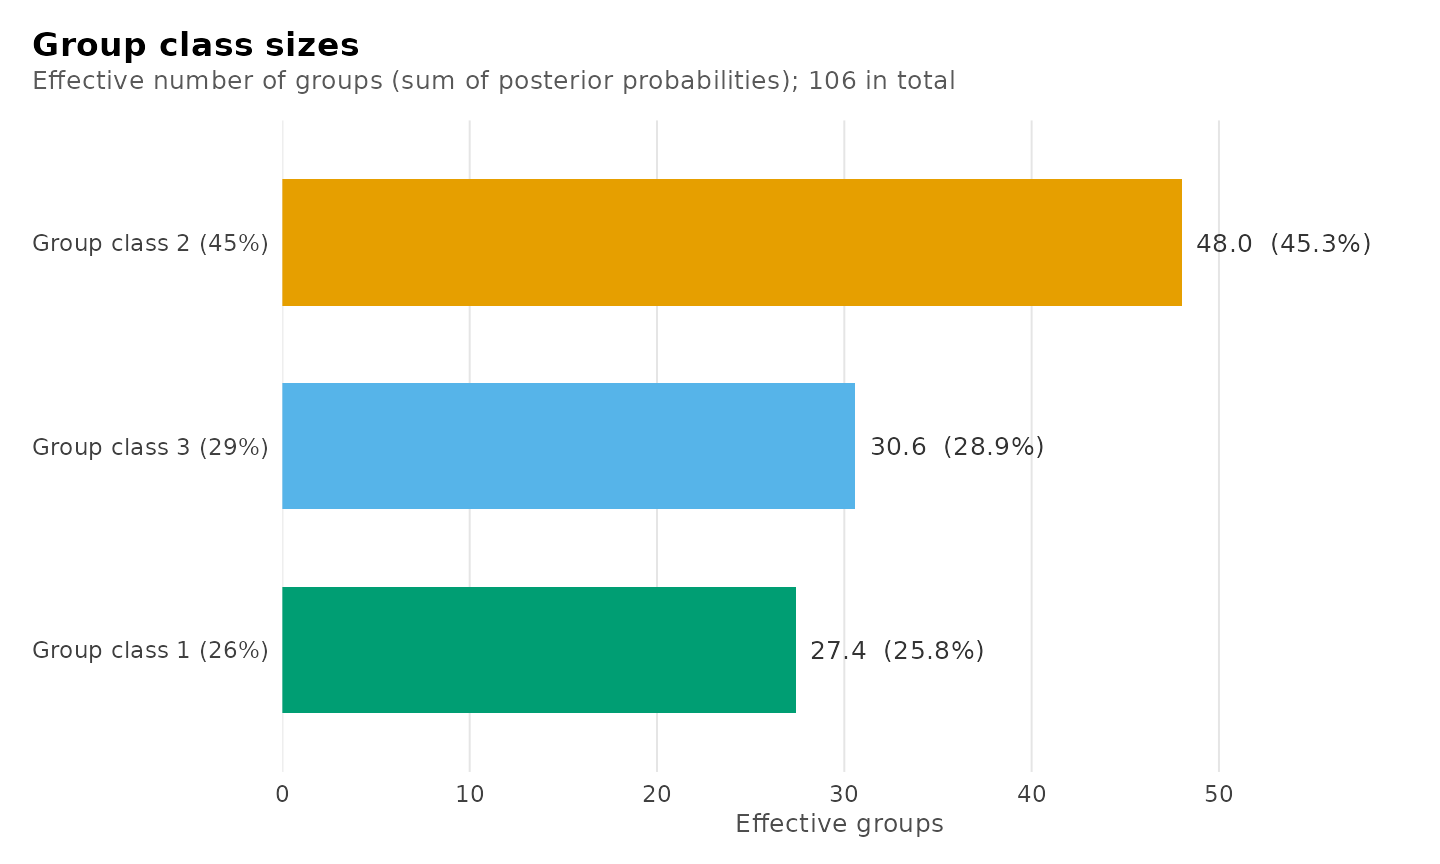
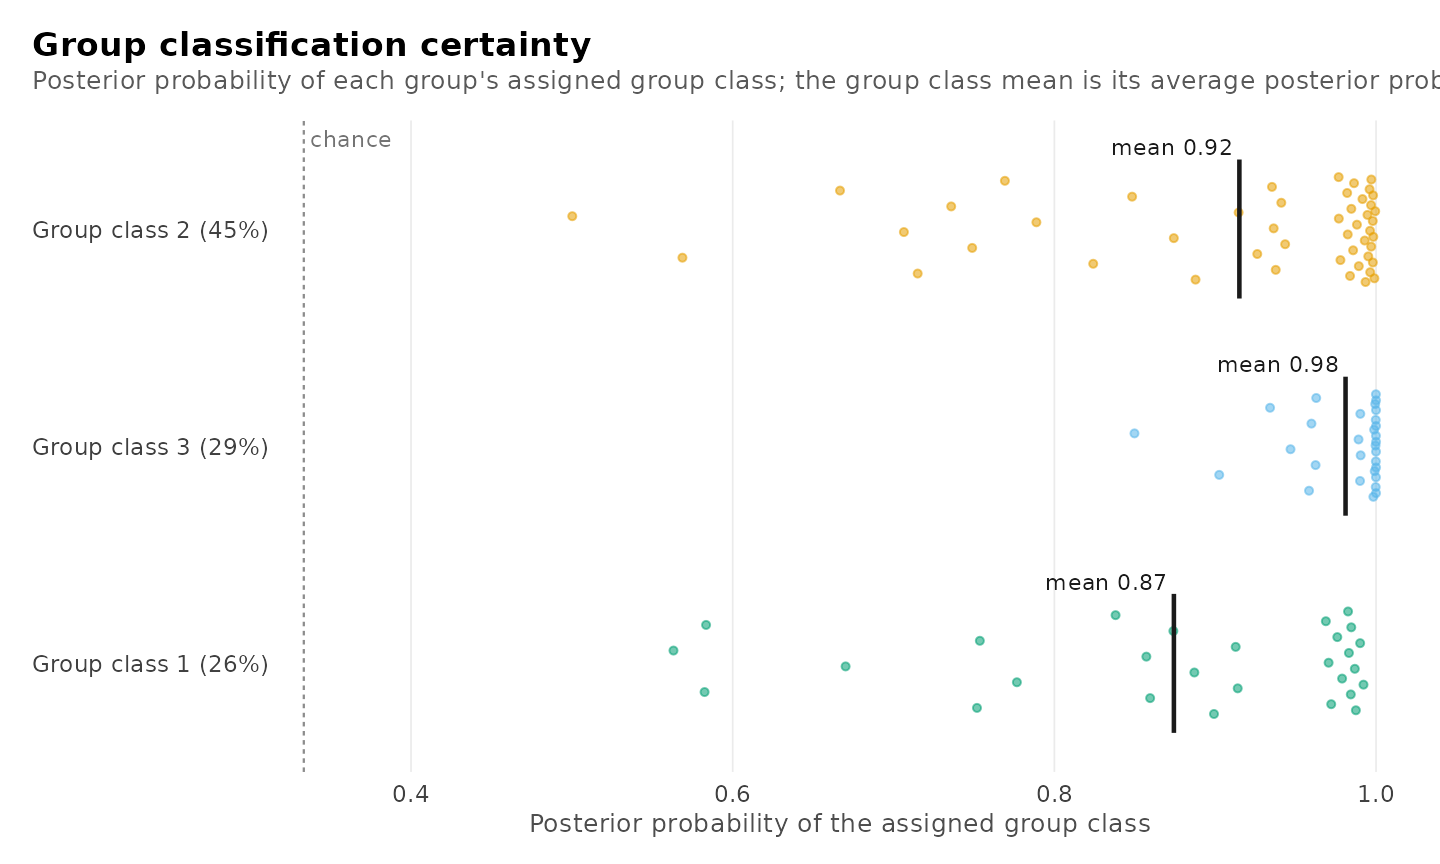
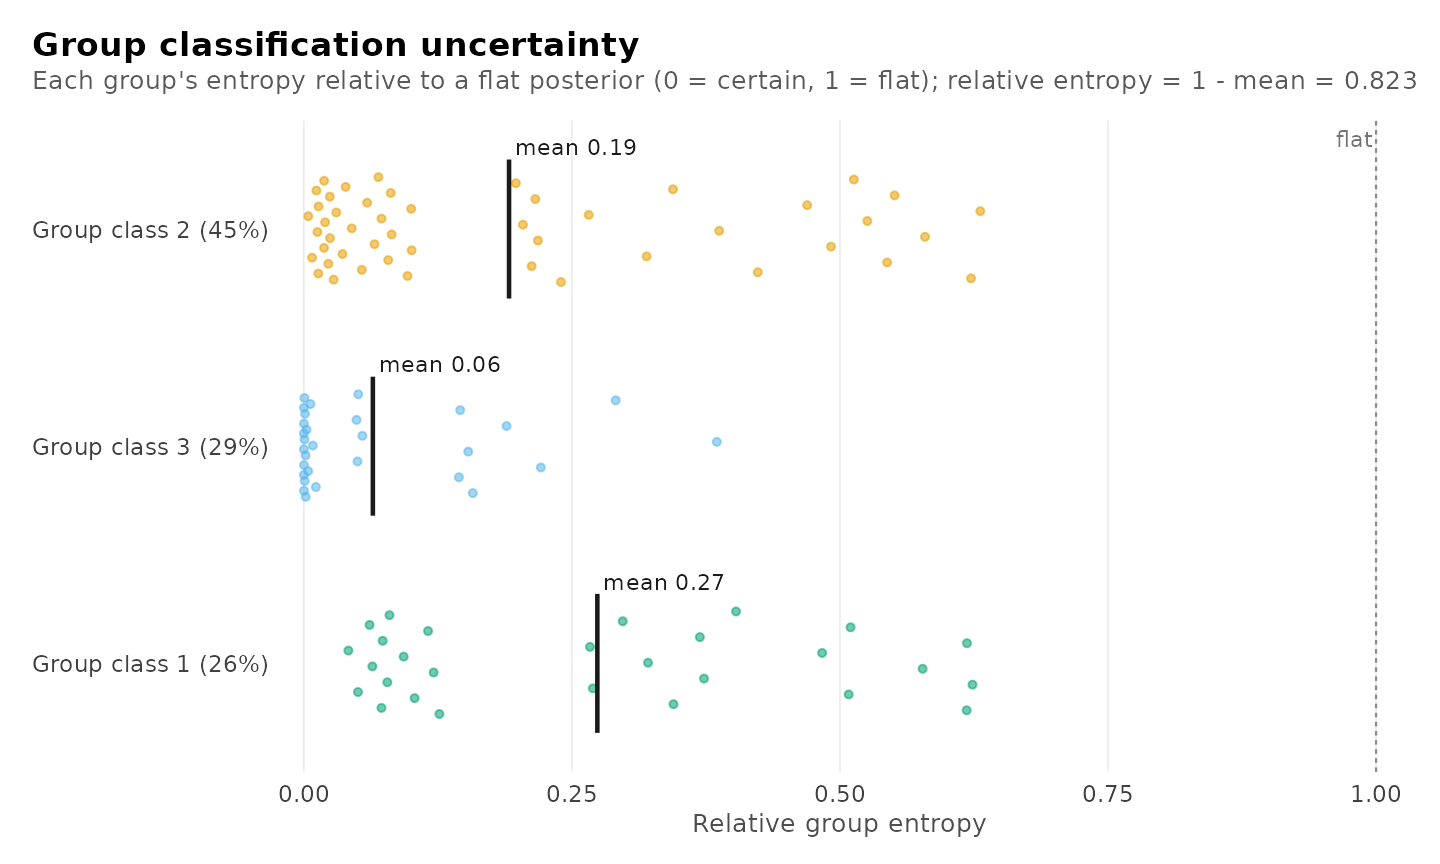
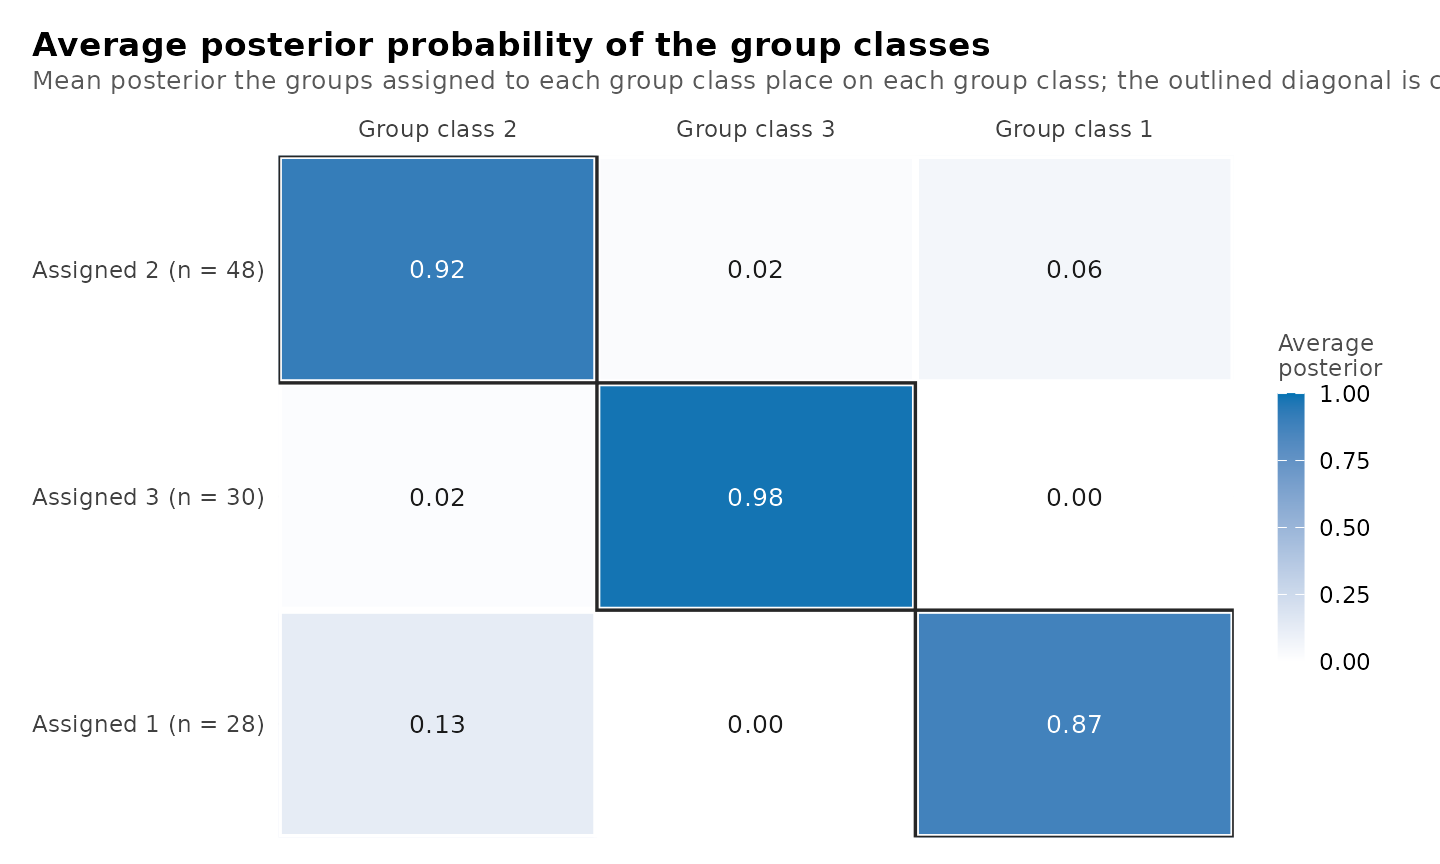
#> Classification quality: 4 profiles, 3 group classes
#>
#>   Relative entropy     individuals 0.739    groups 0.823
#>   Smallest class       individuals 202.2 (14.2%)    groups 27.4 (25.8%)
#>   Lowest avg posterior individuals 0.801    groups 0.874
#>   Largest residual     -0.115  (lectures, forum_post; profile_3)
#>
#> Tables: get_results(x, what = "entropy" | "classification" |
#>         "average_posteriors" | "residuals" | "all"). plot(x) draws them.
plot_diagnostics(chosen)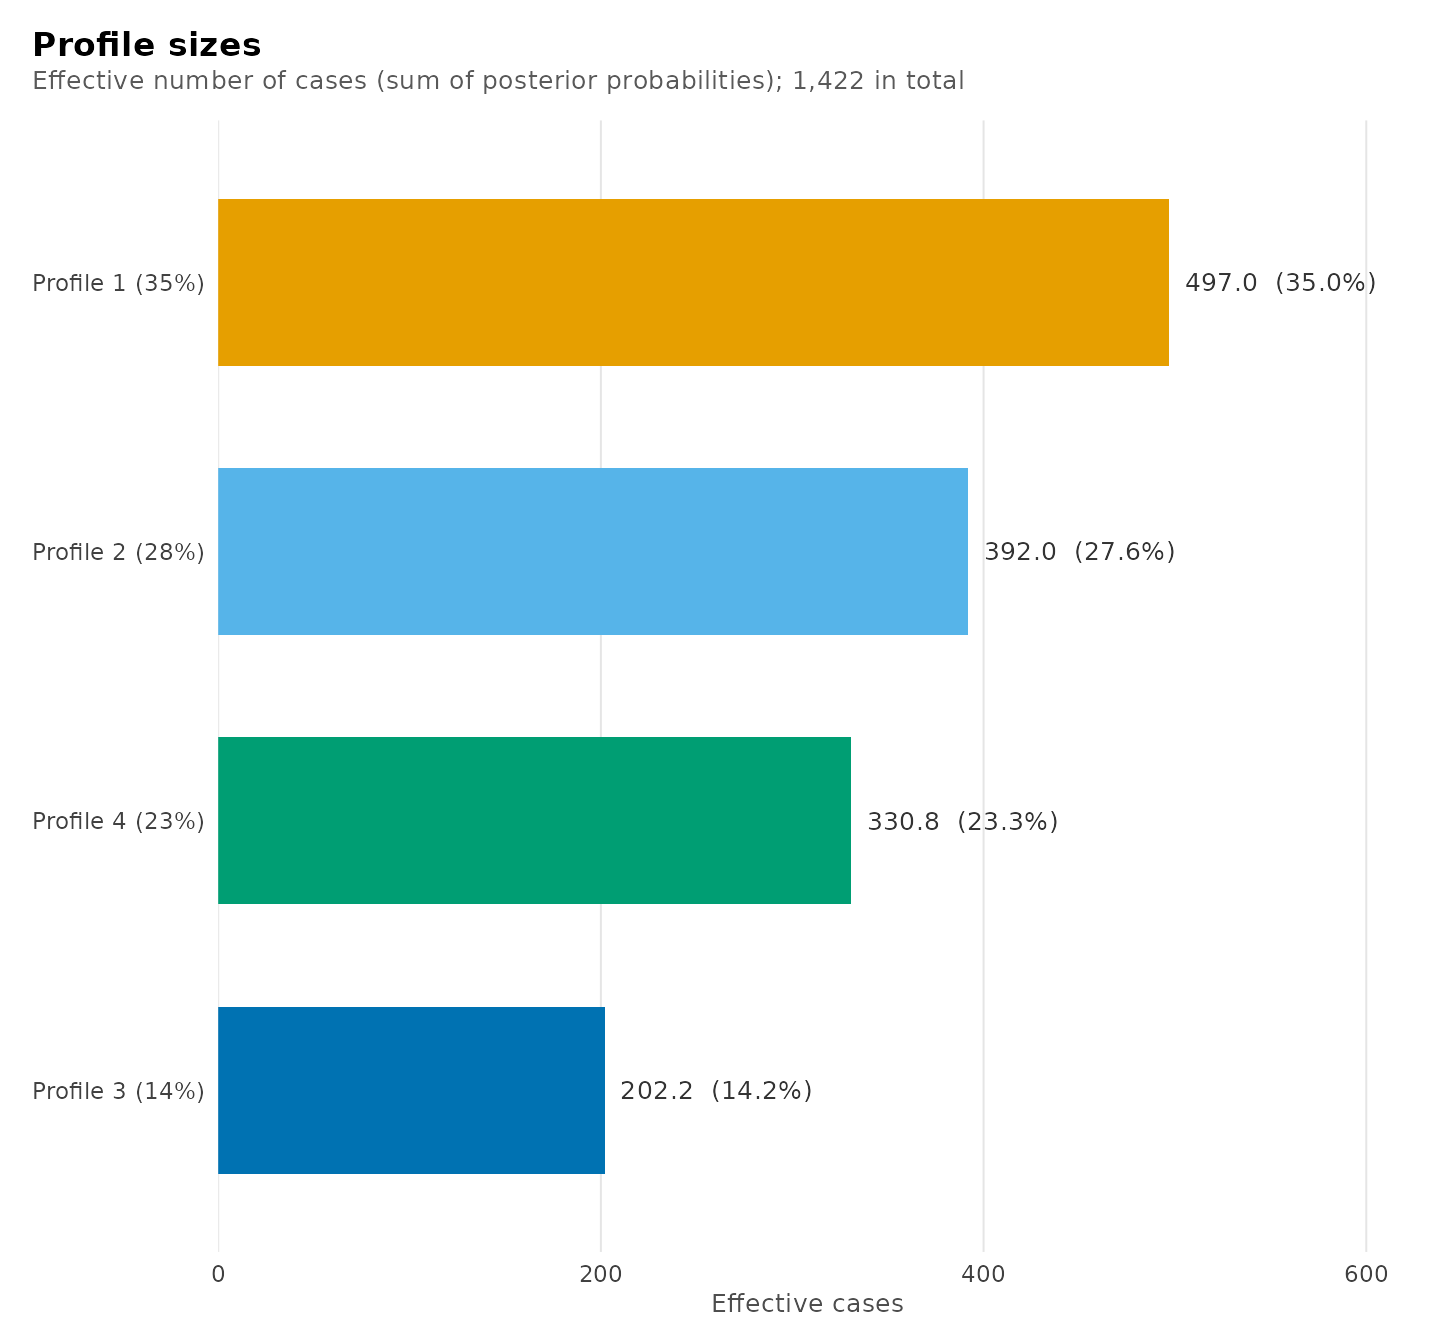
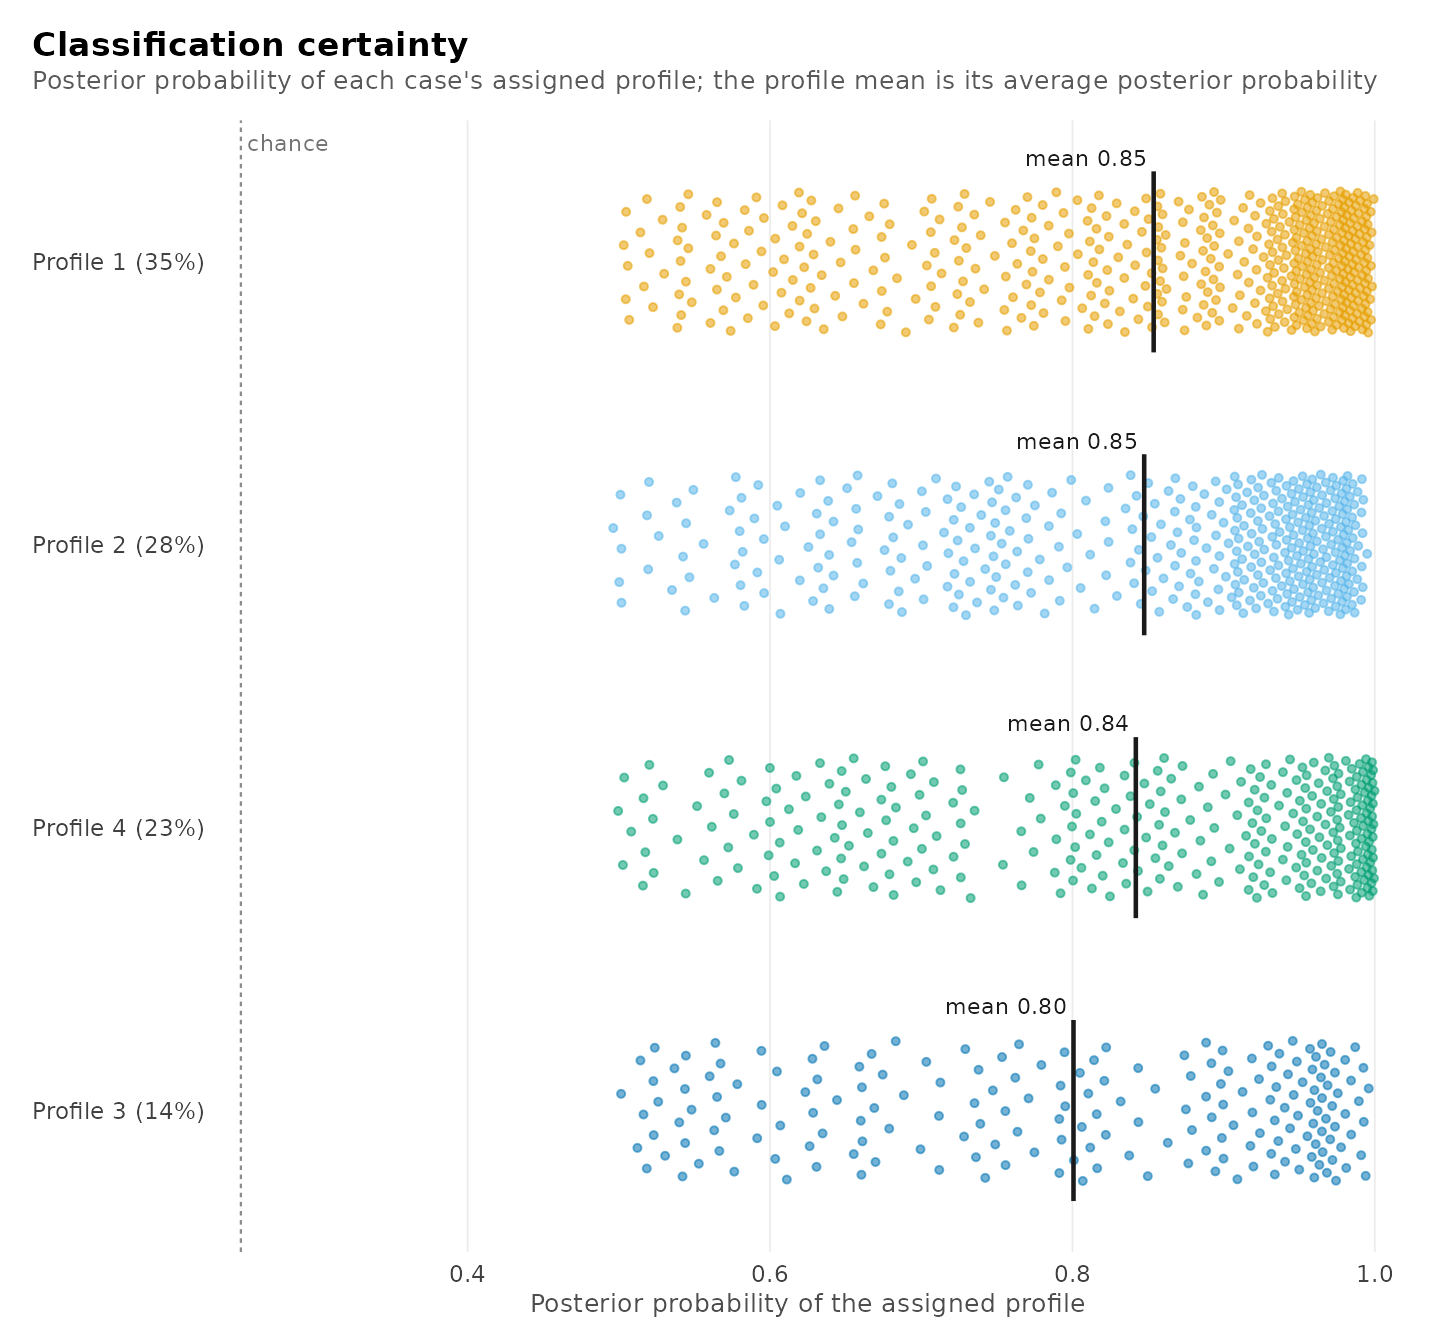
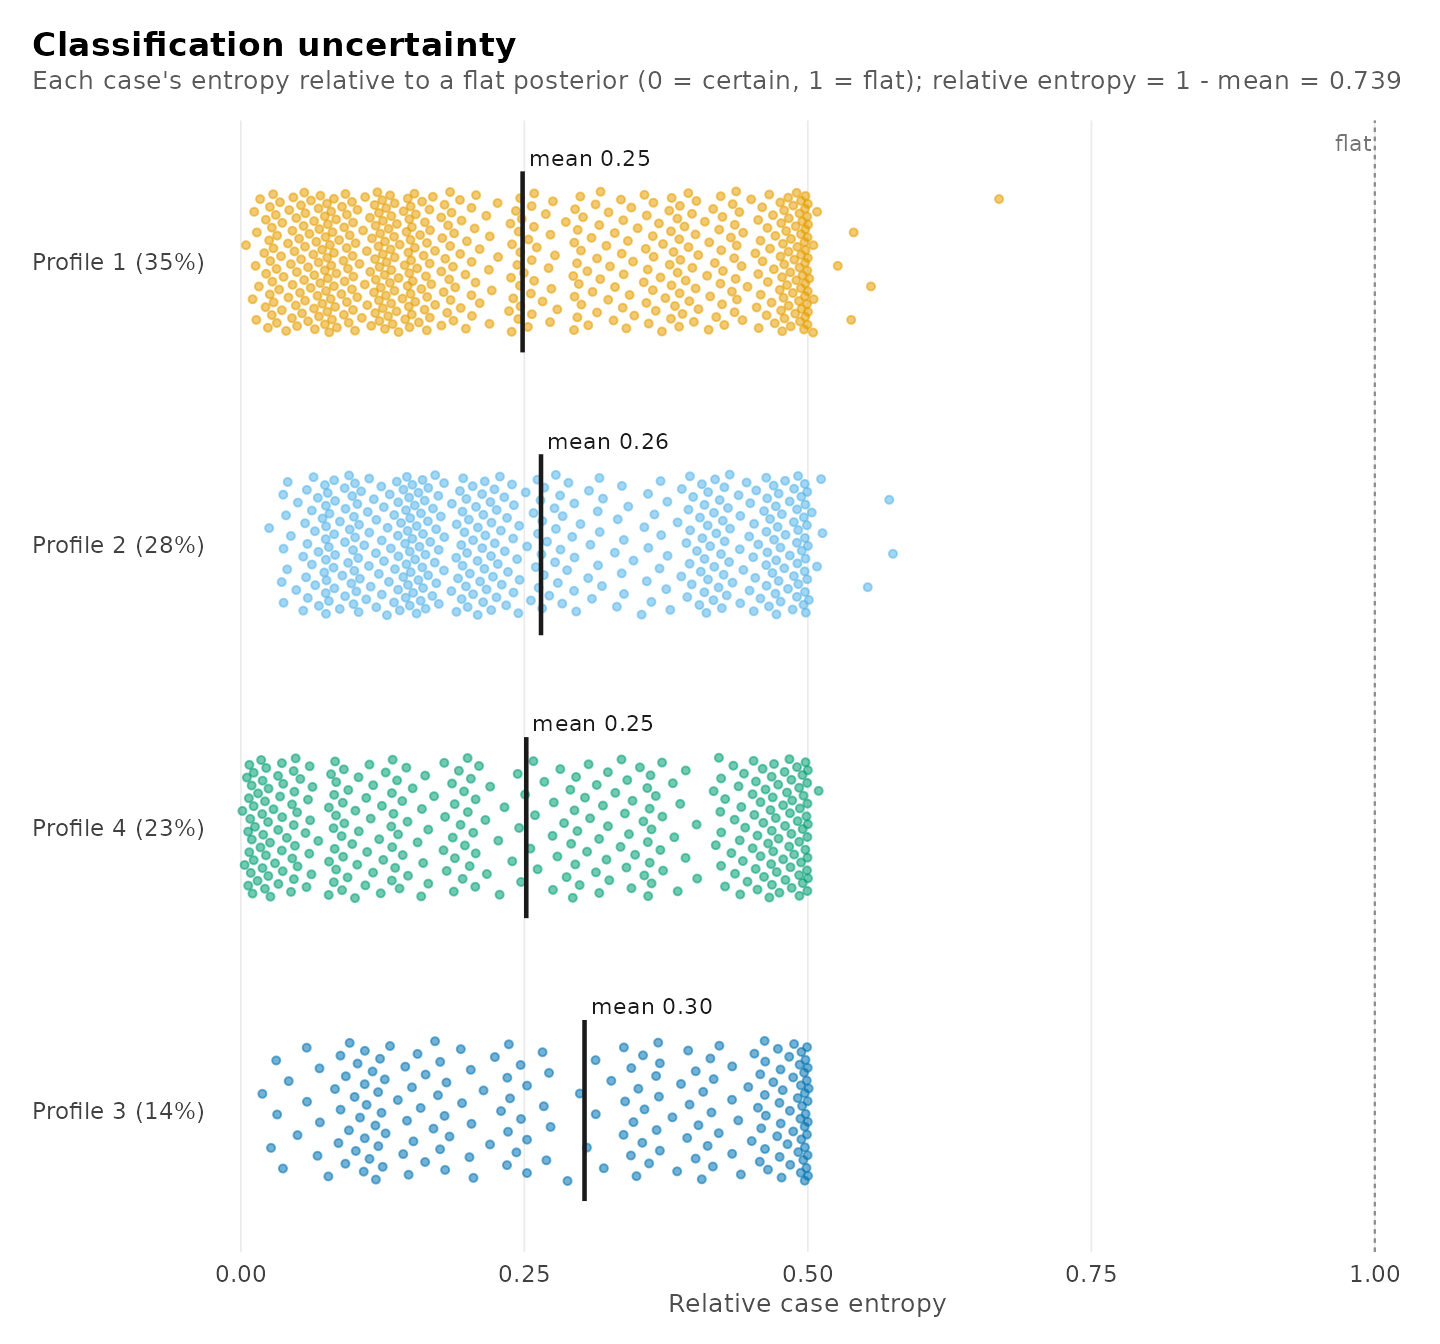
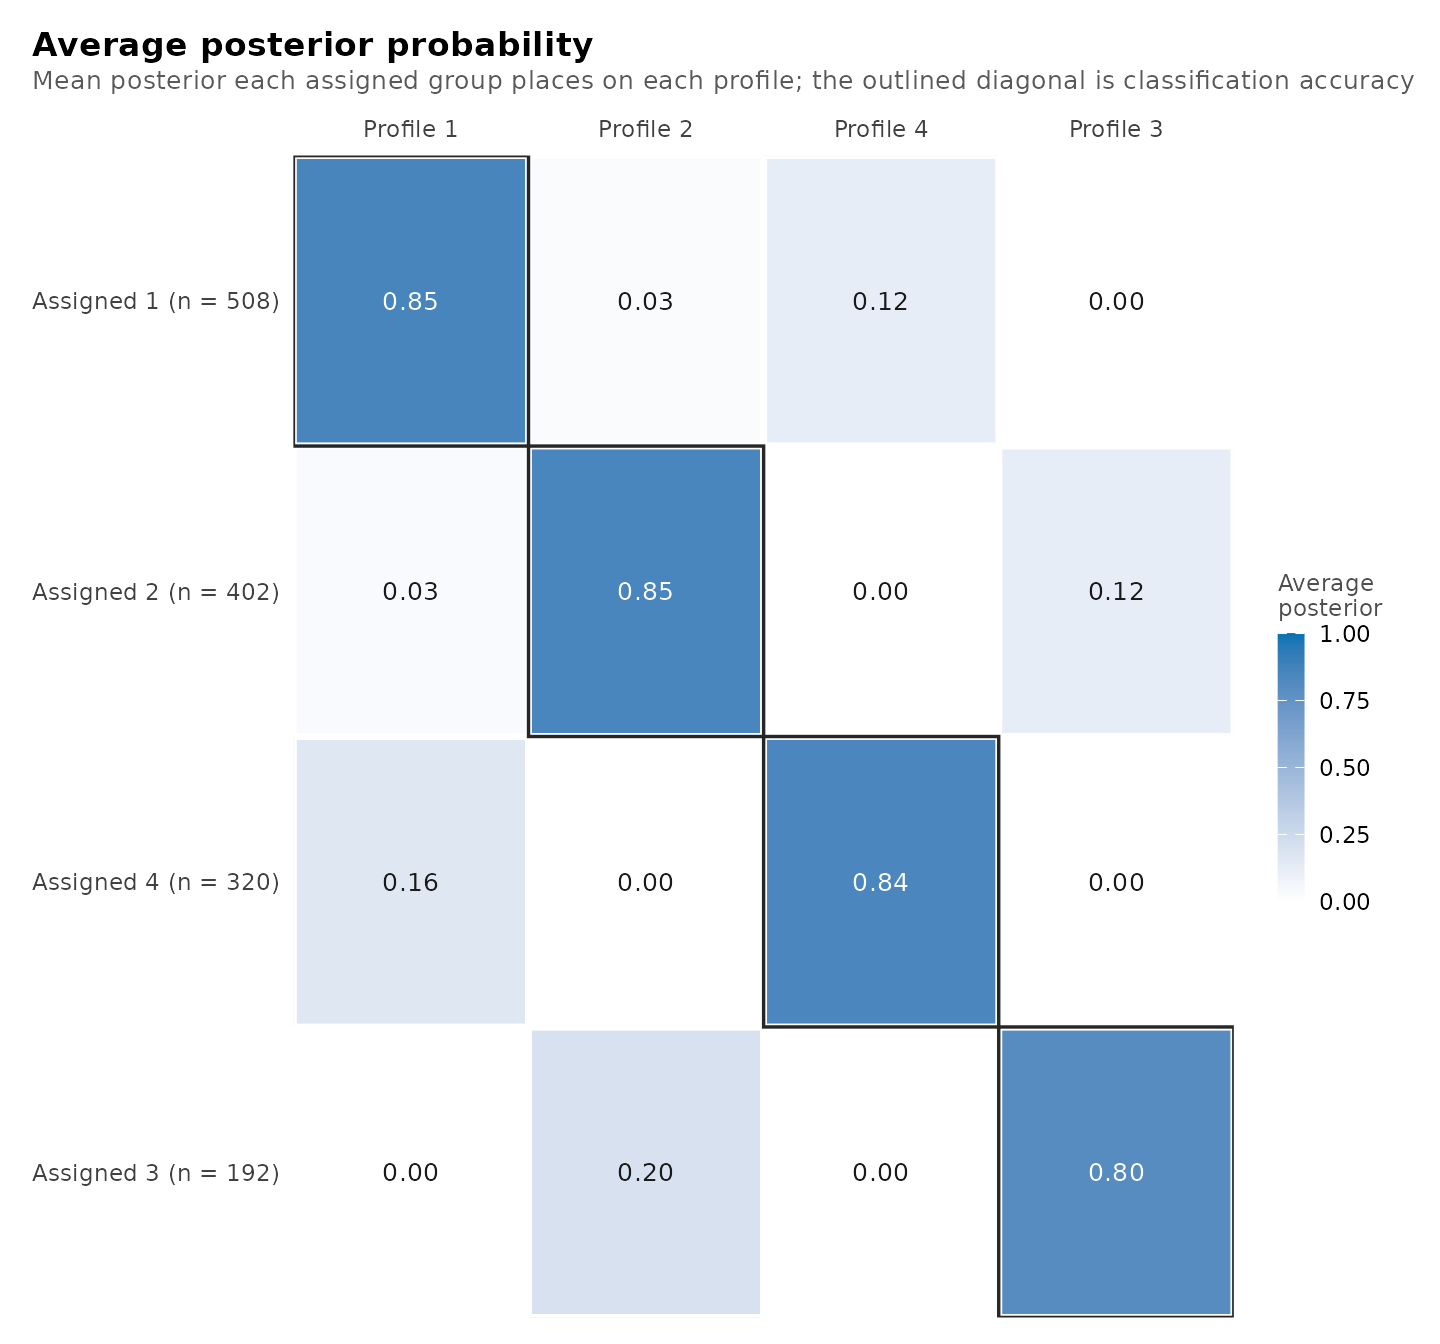
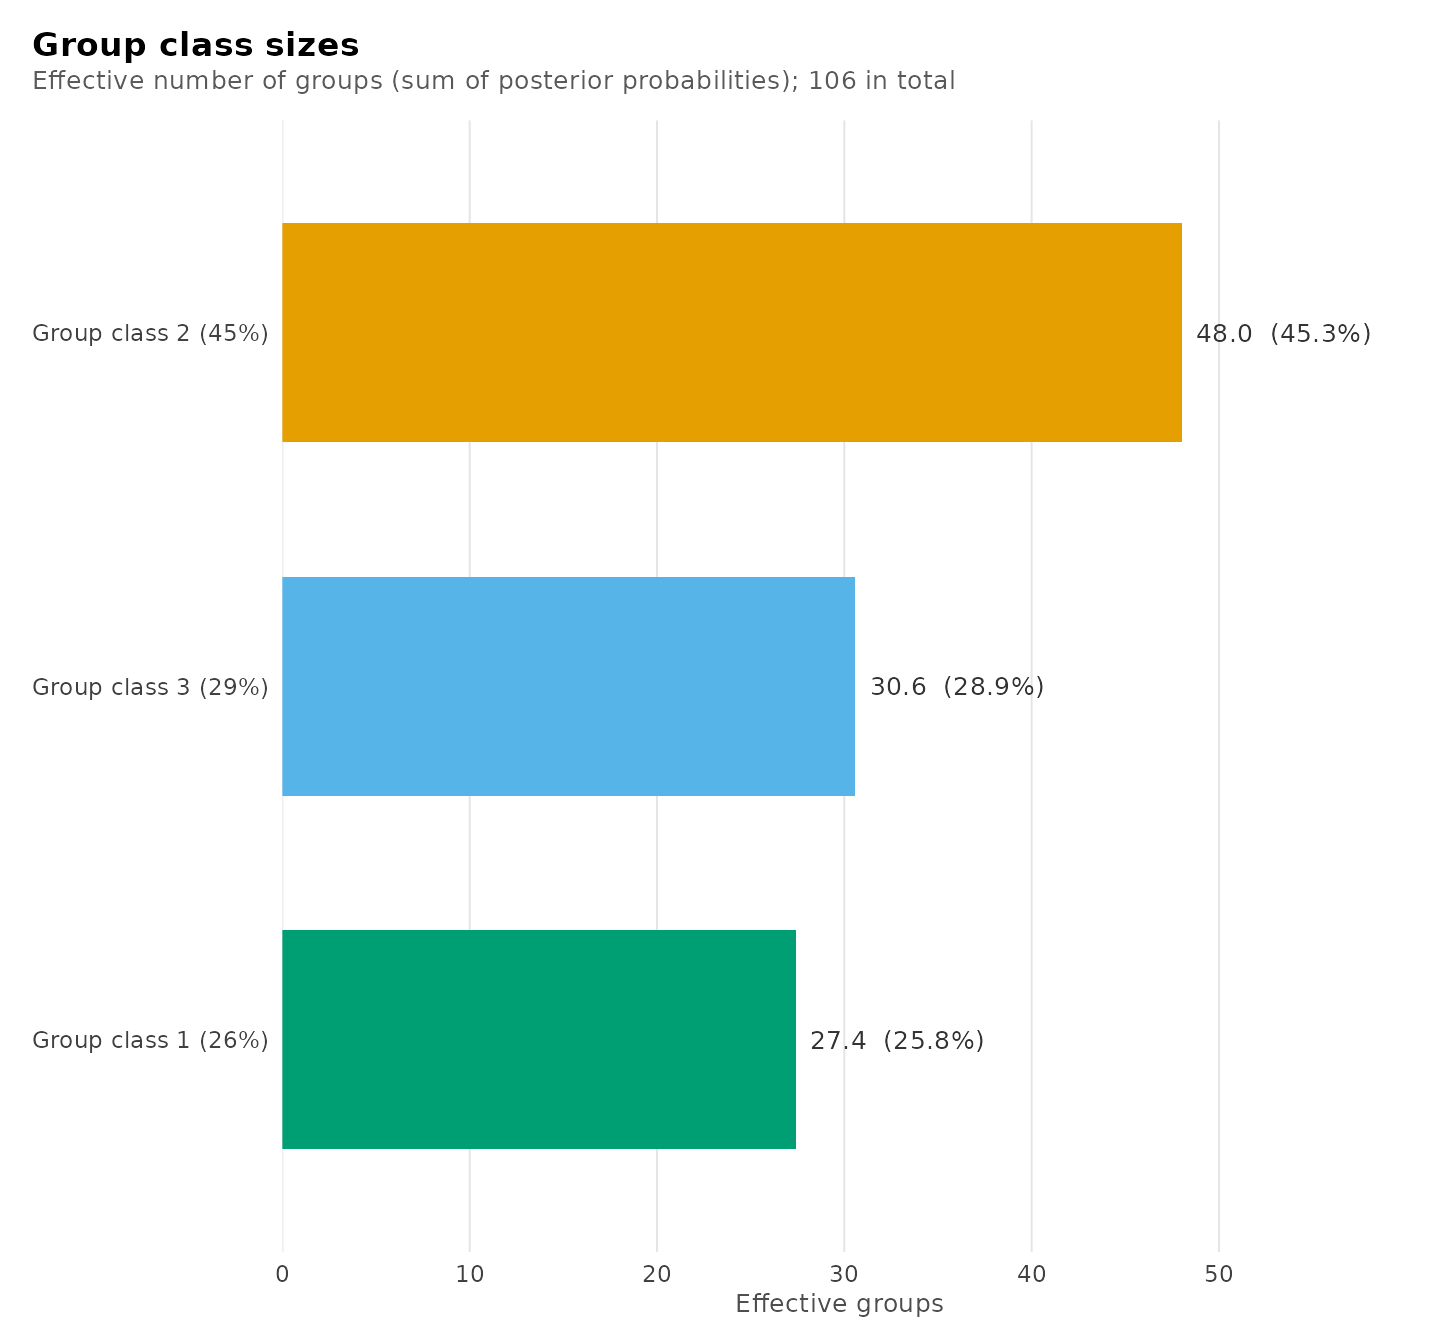
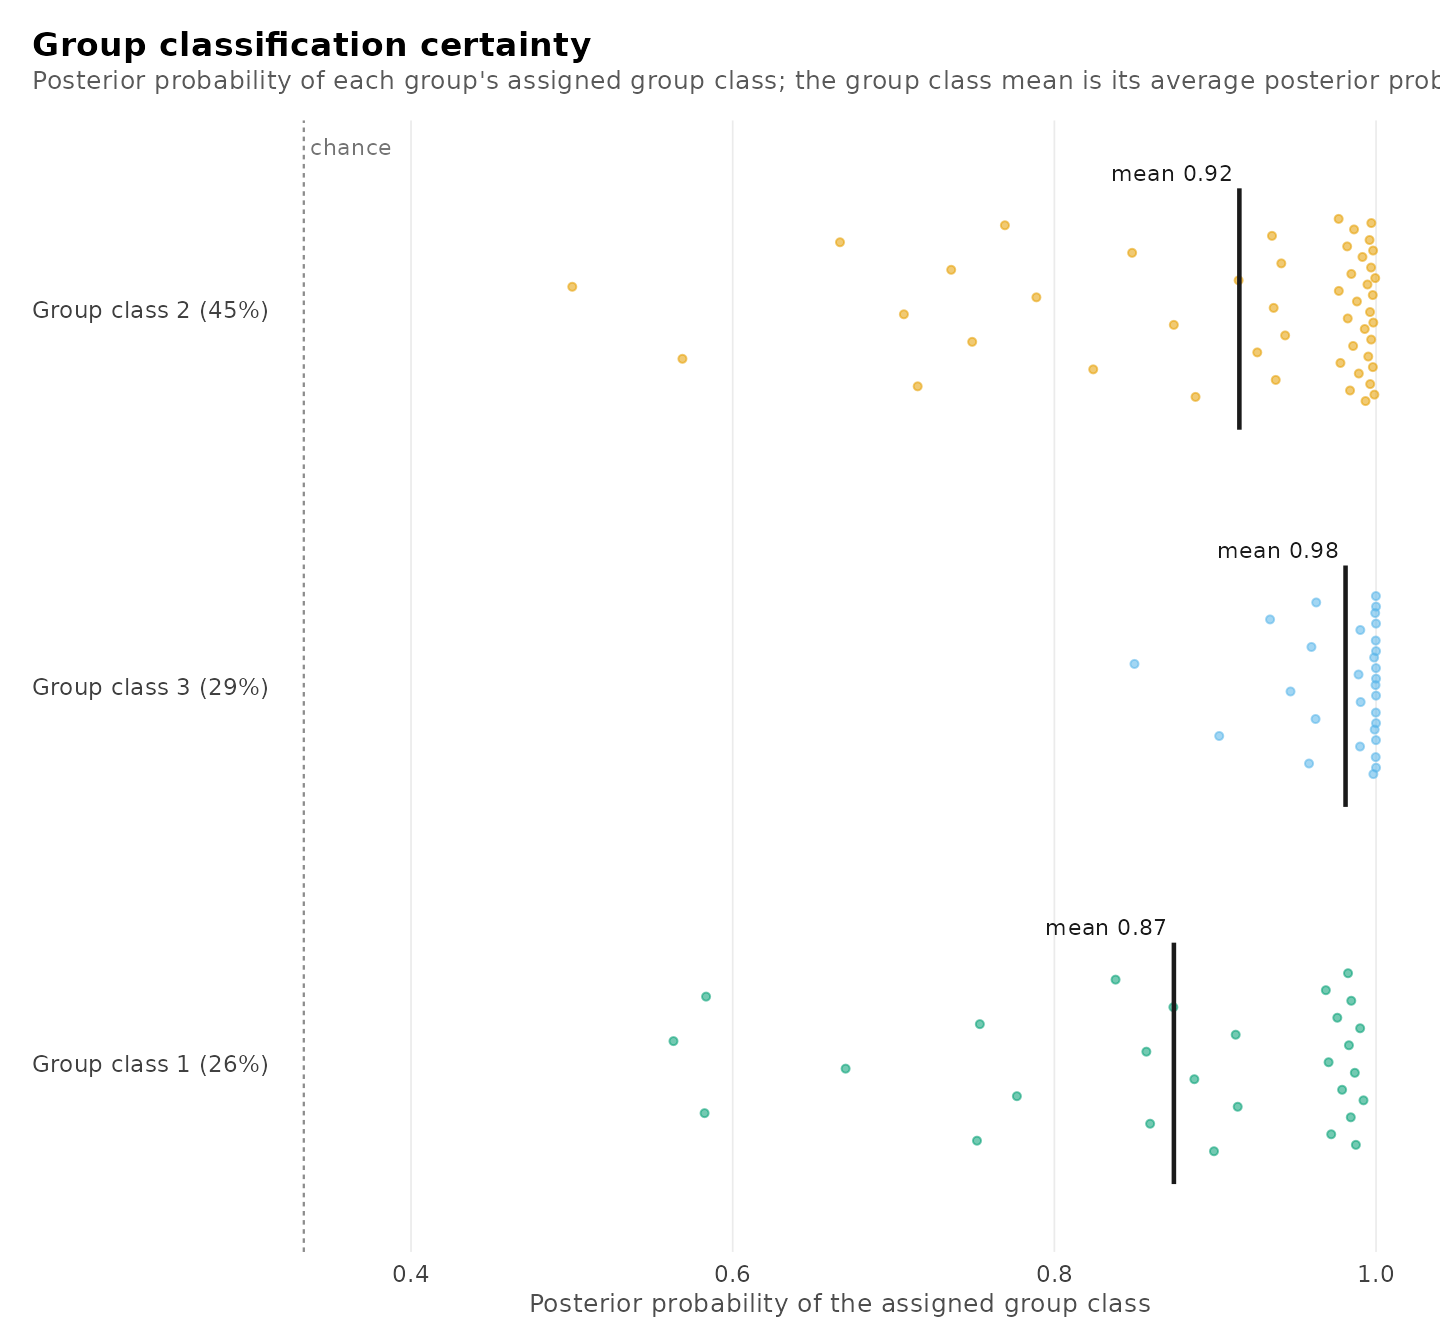
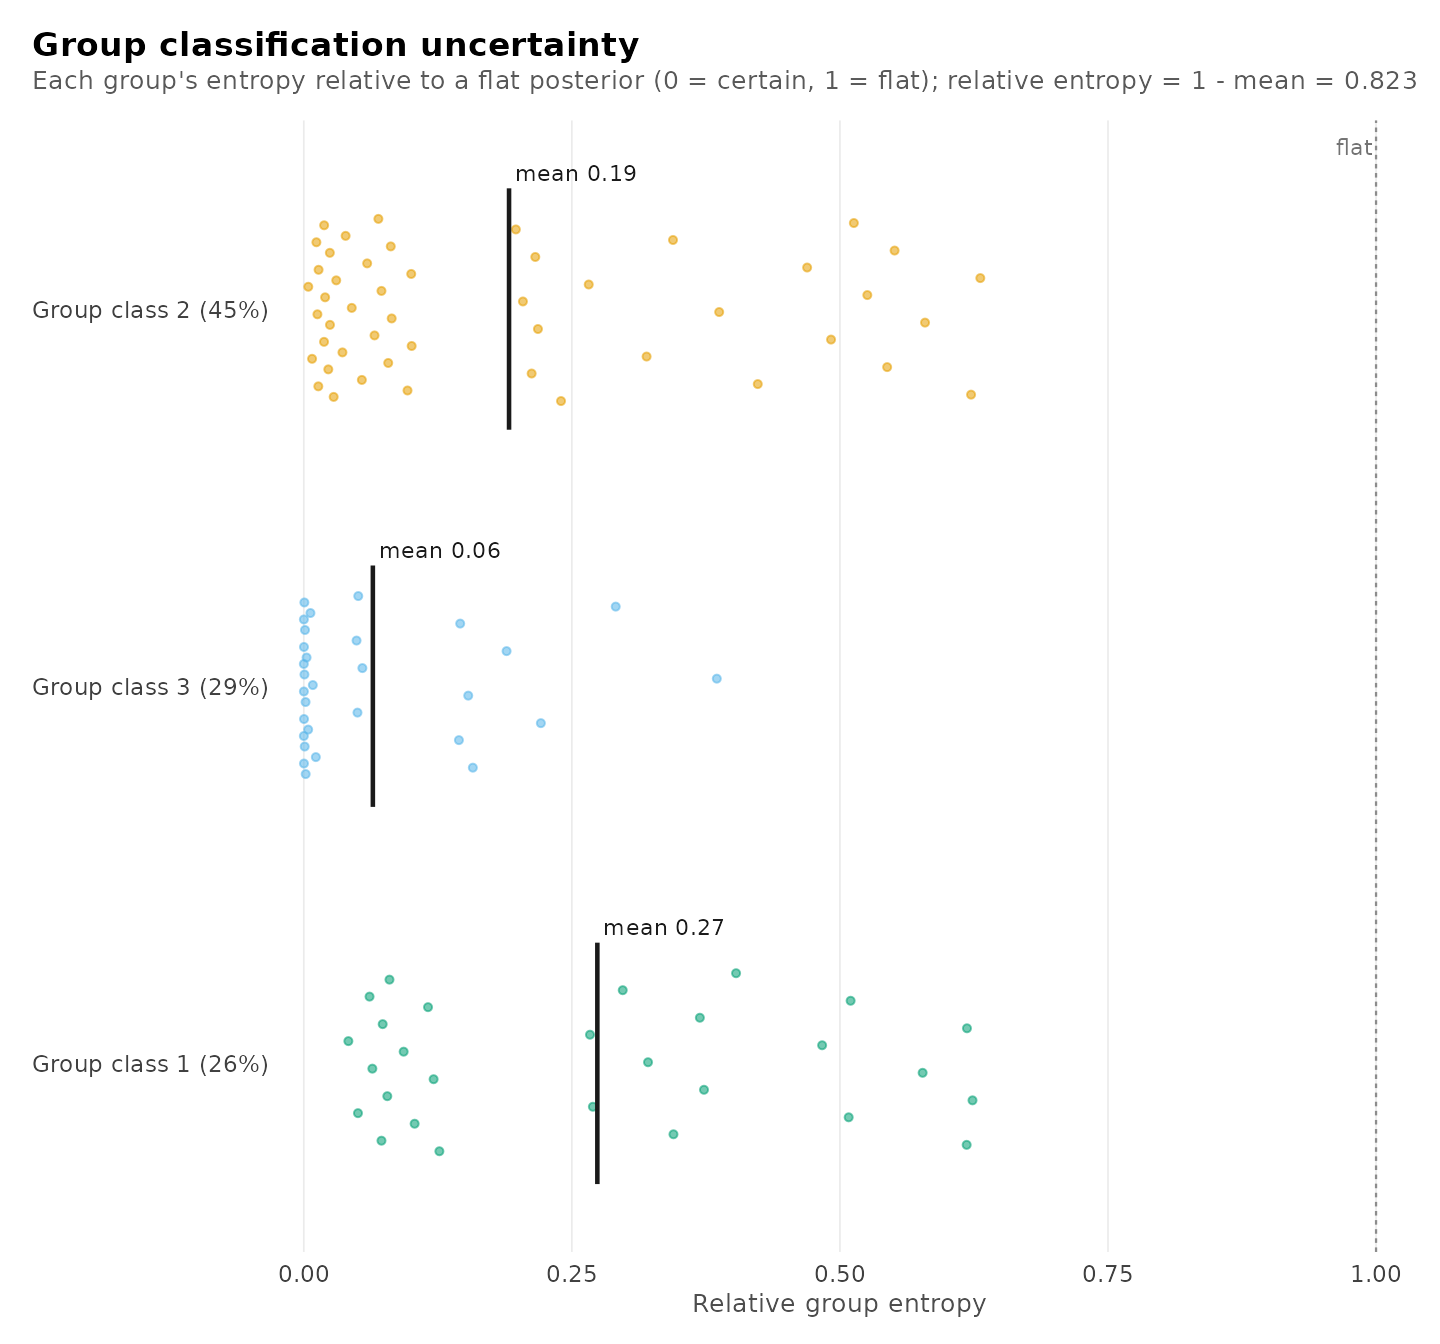
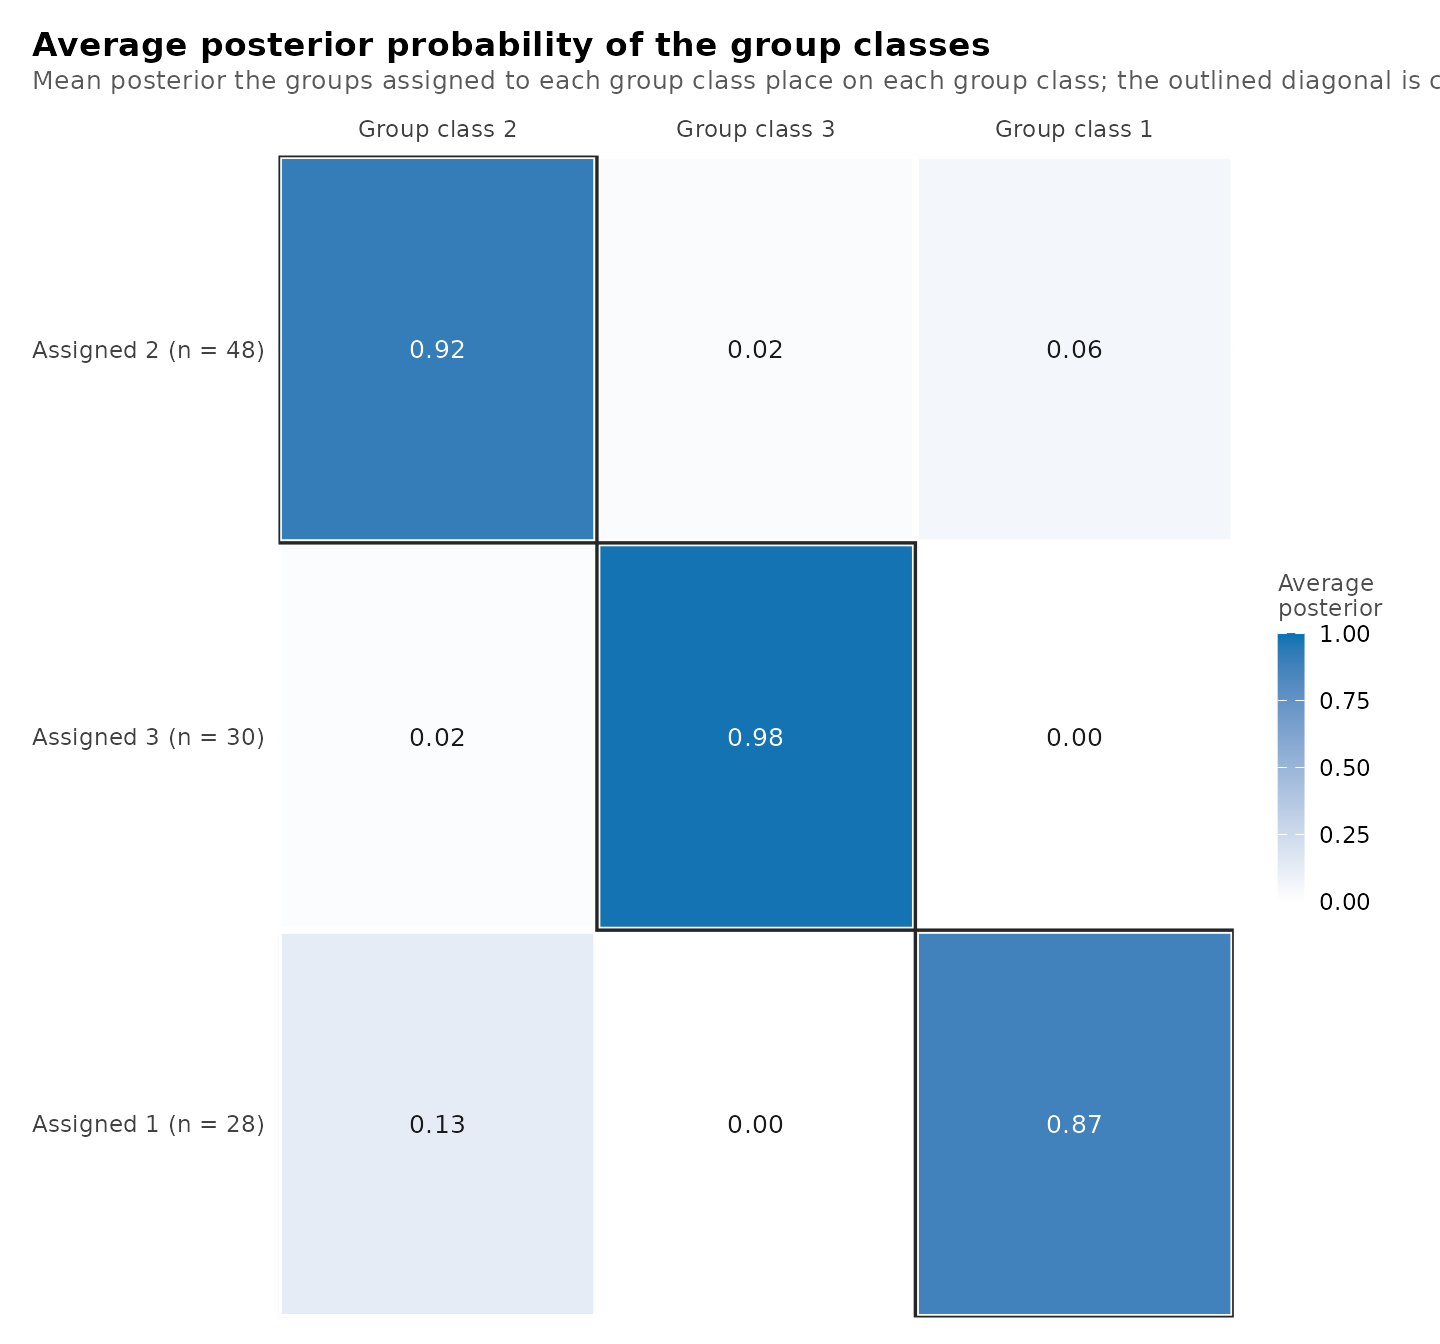
With two or more group classes, the four views for the enrolments in
their profiles are followed by the same views for the students in their
group classes. Because a student is classified from all of their
enrolments jointly, the group classes are typically far better separated
than the profiles. A single view is selected with what, for
example
plot_diagnostics(chosen, what = "group_posteriors").
Each enrolment with its modal profile, the group class of its student and its posterior probabilities:
head(get_results(chosen, "assignments", data = course_engagement))
#>   student course sequence browse lectures forum_read forum_post attendance previous_grade
#> 1       1     23        1   0.73    -0.08       0.30       0.67       0.72           0.54
#> 2       1     19        2   0.68     0.53      -0.02      -0.55       0.70          -0.71
#> 3       1      4        3  -1.51    -0.51      -0.91      -0.80      -0.97           1.98
#> 4       1     18        4   0.64    -1.02      -1.62      -1.20      -1.26          -1.42
#> 5       1     16        5  -0.94    -0.37      -0.71      -0.28      -1.52          -0.67
#> 6       1     29        6  -0.36    -0.46      -0.77      -0.43      -1.34          -0.40
#>   engagement student_type profile group_class uncertainty posterior_profile_1 posterior_profile_2
#> 1    engaged     wavering       4           3       0.500            4.98e-01             0.00203
#> 2    engaged     wavering       1           3       0.327            6.73e-01             0.04917
#> 3 disengaged     wavering       3           3       0.474            2.02e-06             0.47397
#> 4 disengaged     wavering       2           3       0.299            1.72e-06             0.70112
#> 5 disengaged     wavering       3           3       0.377            7.36e-07             0.37665
#> 6 disengaged     wavering       2           3       0.361            5.21e-06             0.63908
#>   posterior_profile_3 posterior_profile_4
#> 1            3.22e-09            5.00e-01
#> 2            5.58e-07            2.78e-01
#> 3            5.26e-01            1.14e-11
#> 4            2.99e-01            5.71e-12
#> 5            6.23e-01            1.13e-12
#> 6            3.61e-01            2.75e-11
The profiles can be related to external variables. The mean of
previous_grade in each profile is estimated with
three_step(), which corrects for classification error by
the BCH method (Bolck, Croon and Hagenaars, 2004; Vermunt, 2010).
three_step(chosen, data = course_engagement, outcome = "previous_grade")
#> Distal outcome by class (bch, 95% CI)
#>
#> Class   Mean          95% CI     SE  Effective n
#> -----  -----  --------------  -----  -----------
#>     1   0.17  [ 0.07,  0.27]  0.050       338.59
#>     2  -0.30  [-0.41, -0.18]  0.058       255.57
#>     3  -0.36  [-0.53, -0.20]  0.084       111.57
#>     4   0.32  [ 0.18,  0.45]  0.069       210.39
Testing neighbouring candidates
The bootstrap likelihood ratio test (McLachlan, 1987) compares two
candidates that differ by one class. Data sets are simulated from the
smaller candidate and both candidates are re-estimated on each. With
B simulated data sets, of which b yield a
likelihood ratio at least as large as the observed one, the p-value is
(b + 1) / (B + 1) (Davison and Hinkley, 1997); the
additional count includes the observed statistic and precludes a p-value
of zero from a finite simulation. The p-value is withheld unless every
replicate satisfies the estimation checks. The test below compares three
and four profiles with three group classes. Nineteen simulated data sets
keep the example brief; the smallest attainable p-value is then 1/20 =
0.05, and applied analyses should use at least 99.
smaller <- get_candidate(models, "profiles3_groups3")
larger <- get_candidate(models, "profiles4_groups3")
test <- bootstrap_lrt(smaller, larger, data = course_engagement,
                      iter = 19, n_starts = 2, seed = 1)
test
#> Parametric bootstrap likelihood-ratio comparison
#> Null: 3 profiles, 3 group classes; alternative: 4 profiles, 3 group classes
#> Observed statistic: 82.548767
#> p-value: 0.05 (Monte Carlo SE 0.0487) from 19 of 19 valid replicates
plot(test)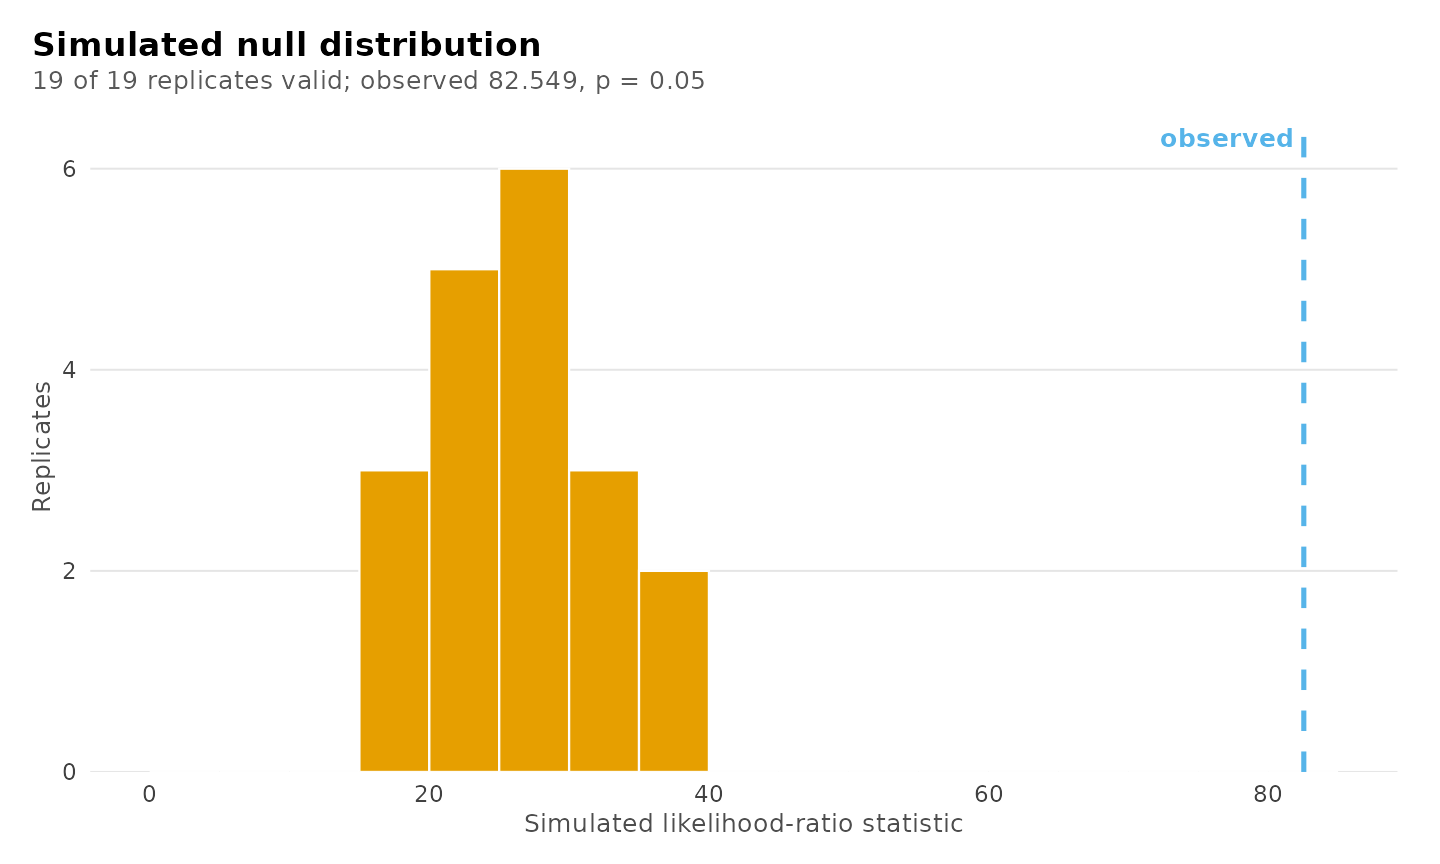
Other model types
Latent class models
student_esm contains 2,582 momentary reports from
students, with eight activities recorded as present or absent. Declaring
the indicators in categorical makes every candidate a
latent class model, and the candidates are named with
classes in place of profiles.
activities <- c("time_with_friends", "on_social_media", "tv_video_games",
                "listened_music", "sports", "walking", "reading",
                "part_time_job")
lca_models <- enumerate_classes(student_esm, activities, "student",
                                n_profiles = 2:4, n_group_classes = 1:2,
                                categorical = activities, n_starts = 5,
                                seed = 1)
lca_models
#> Class enumeration: 6 candidate models
#>         candidate n_profiles n_group_classes model log_likelihood n_parameters   aic bic_groups
#>  classes2_groups1          2               1  <NA>          -7892           17 15819      15863
#>  classes3_groups1          3               1  <NA>          -7848           26 15749      15817
#>  classes4_groups1          4               1  <NA>          -7811           35 15692      15783
#>  classes2_groups2          2               2  <NA>          -7740           19 15518      15567
#>  classes3_groups2          3               2  <NA>          -7686           29 15429      15505
#>  classes4_groups2          4               2  <NA>          -7634           39 15346      15447
#>  bic_individual icl_individual profile_entropy group_entropy avepp_min avepp_max avepp_mean
#>           15918          17771           0.482            NA     0.706     0.940      0.823
#>           15901          17820           0.662            NA     0.704     0.952      0.863
#>           15897          18111           0.691            NA     0.722     0.997      0.814
#>           15629          16818           0.668         0.877     0.859     0.926      0.892
#>           15599          18122           0.555         0.901     0.642     0.879      0.783
#>           15574          18070           0.651         0.914     0.631     0.992      0.819
#>  avepp_below group_avepp_min group_avepp_max group_avepp_mean group_avepp_below converged boundary
#>            1              NA              NA               NA                NA      TRUE    FALSE
#>            1              NA              NA               NA                NA      TRUE    FALSE
#>            3              NA              NA               NA                NA      TRUE    FALSE
#>            0           0.960           0.980            0.970                 0      TRUE    FALSE
#>            1           0.959           0.977            0.968                 0      TRUE    FALSE
#>            1           0.974           0.986            0.980                 0      TRUE    FALSE
#>  n_best_replicated
#>                  5
#>                  2
#>                  1
#>                  4
#>                  1
#>                  1
#> No candidate is selected automatically. Compare one convention consistently.
plot_selection(lca_models, what = "diagnostics")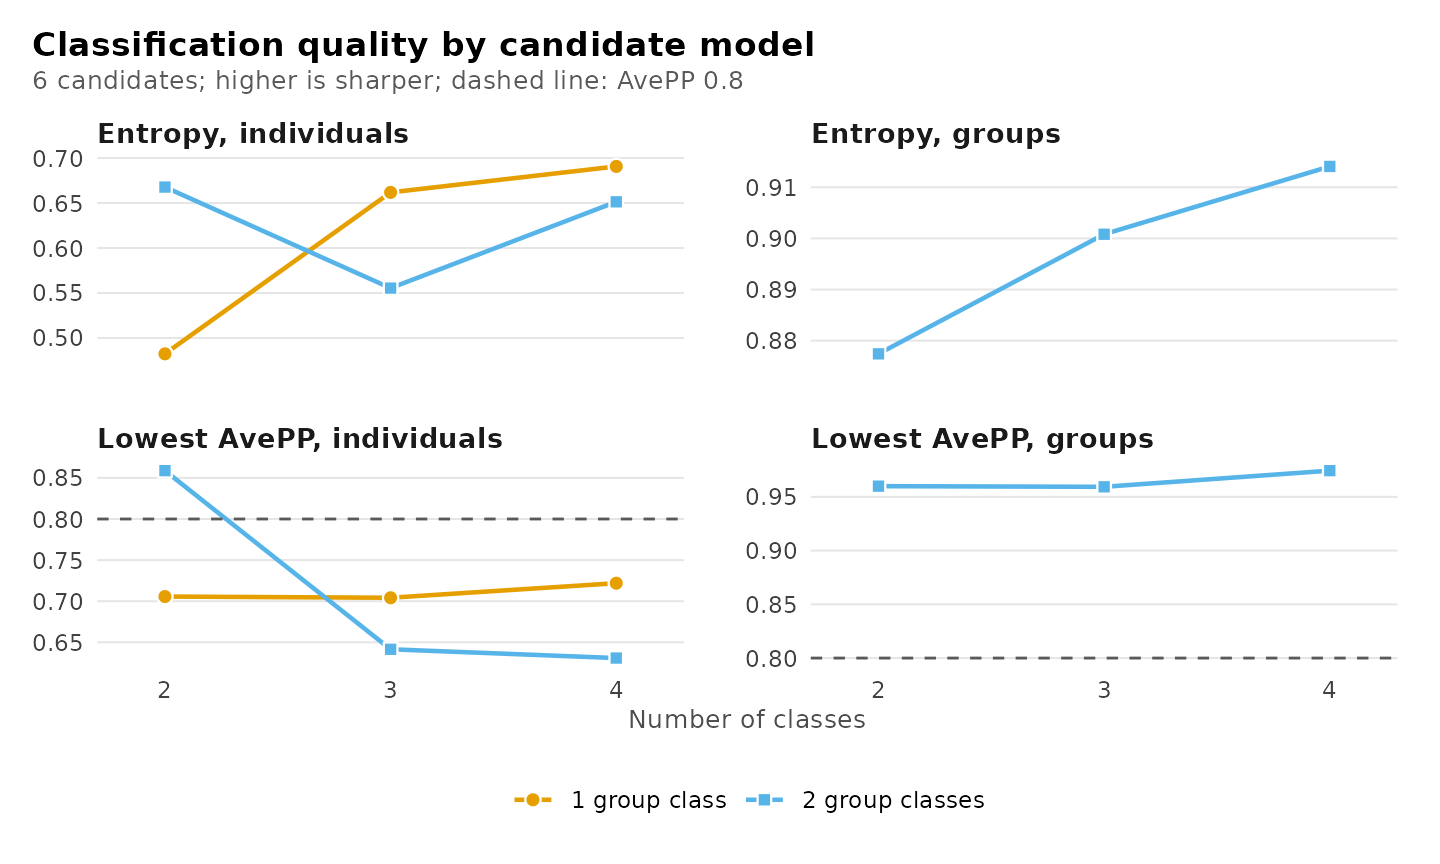
compare_models(lca_models, n_profiles = 3)
#> Model comparison
#>
#> Model             Classes  Group classes   k    LogLik       BIC    ΔBIC  Weight       ICL  Entropy  Min AvePP  < 0.8  Group entropy  Group min AvePP
#> ----------------  -------  -------------  --  --------  --------  ------  ------  --------  -------  ---------  -----  -------------  ---------------
#> classes3_groups1        3              1  26  -7848.45  15816.64  311.61   0.000  17819.69     0.66       0.70      1
#> classes3_groups2        3              2  29  -7685.74  15505.03    0.00   1.000  18121.50     0.56       0.64      1           0.90             0.96
Among the three-class models, the model with two group classes has the lower BIC. Its relative entropy is 0.56, and its least distinct class has an AvePP of 0.64. The classes of this model overlap substantially, which limits their substantive interpretation.
Single-level models
Observations without a grouping structure are modelled with
enumerate_lpa() for continuous indicators and
enumerate_lca() for categorical indicators. The candidates
are named by their numbers of profiles or classes alone.
srl_models <- enumerate_lpa(srl, c("cognitive_strategies", "intrinsic_value",
                                   "self_efficacy", "self_regulation",
                                   "test_anxiety"),
                            n_profiles = 1:8, model = "VVI", n_starts = 10,
                            seed = 1)
#> Warning: A variance reached min_variance; this is a bound-active constrained fit.
#> Warning: A profile or group class has effective membership below one.
srl_models
#> Class enumeration: 8 candidate models
#>  candidate n_profiles n_group_classes model log_likelihood n_parameters  aic bic_groups
#>  profiles1          1               1   VVI          -1247           10 2515       2552
#>  profiles2          2               1   VVI           -889           21 1821       1898
#>  profiles3          3               1   VVI           -736           32 1535       1654
#>  profiles4          4               1   VVI           -683           43 1451       1611
#>  profiles5          5               1   VVI           -644           54 1397       1597
#>  profiles6          6               1   VVI           -611           65 1351       1592
#>  profiles7          7               1   VVI           -591           76 1334       1615
#>  profiles8          8               1   VVI           -559           87 1292       1615
#>  bic_individual icl_individual profile_entropy group_entropy avepp_min avepp_max avepp_mean
#>            2552           2552              NA            NA        NA        NA         NA
#>            1898           1940           0.899            NA     0.969     0.979      0.974
#>            1654           1714           0.909            NA     0.936     0.975      0.959
#>            1611           1728           0.859            NA     0.885     0.954      0.917
#>            1597           1684           0.909            NA     0.921     0.949      0.938
#>            1592           1708           0.892            NA     0.886     0.959      0.934
#>            1615           1742           0.892            NA     0.892     0.953      0.928
#>            1615           1743           0.897            NA     0.896     1.000      0.937
#>  avepp_below group_avepp_min group_avepp_max group_avepp_mean group_avepp_below converged boundary
#>           NA              NA              NA               NA                NA      TRUE    FALSE
#>            0              NA              NA               NA                NA      TRUE    FALSE
#>            0              NA              NA               NA                NA      TRUE    FALSE
#>            0              NA              NA               NA                NA      TRUE    FALSE
#>            0              NA              NA               NA                NA      TRUE    FALSE
#>            0              NA              NA               NA                NA      TRUE    FALSE
#>            0              NA              NA               NA                NA      TRUE    FALSE
#>            0              NA              NA               NA                NA      TRUE     TRUE
#>  n_best_replicated
#>                 10
#>                 10
#>                 10
#>                  8
#>                  7
#>                  5
#>                  1
#>                  1
#> No candidate is selected automatically. Compare one convention consistently.
compare_models(srl_models, "profiles5", "profiles6", "profiles7")
#> Model comparison
#>
#> Model      Profiles   k   LogLik      BIC   ΔBIC  Weight      ICL  Entropy  Min AvePP  < 0.8
#> ---------  --------  --  -------  -------  -----  ------  -------  -------  ---------  -----
#> profiles5         5  54  -644.38  1596.76   4.98   0.077  1684.33     0.91       0.92      0
#> profiles6         6  65  -610.52  1591.78   0.00   0.923  1707.76     0.89       0.89      0
#> profiles7         7  76  -590.85  1615.18  23.40   0.000  1741.68     0.89       0.89      0
plot_selection(srl_models, what = "deltas")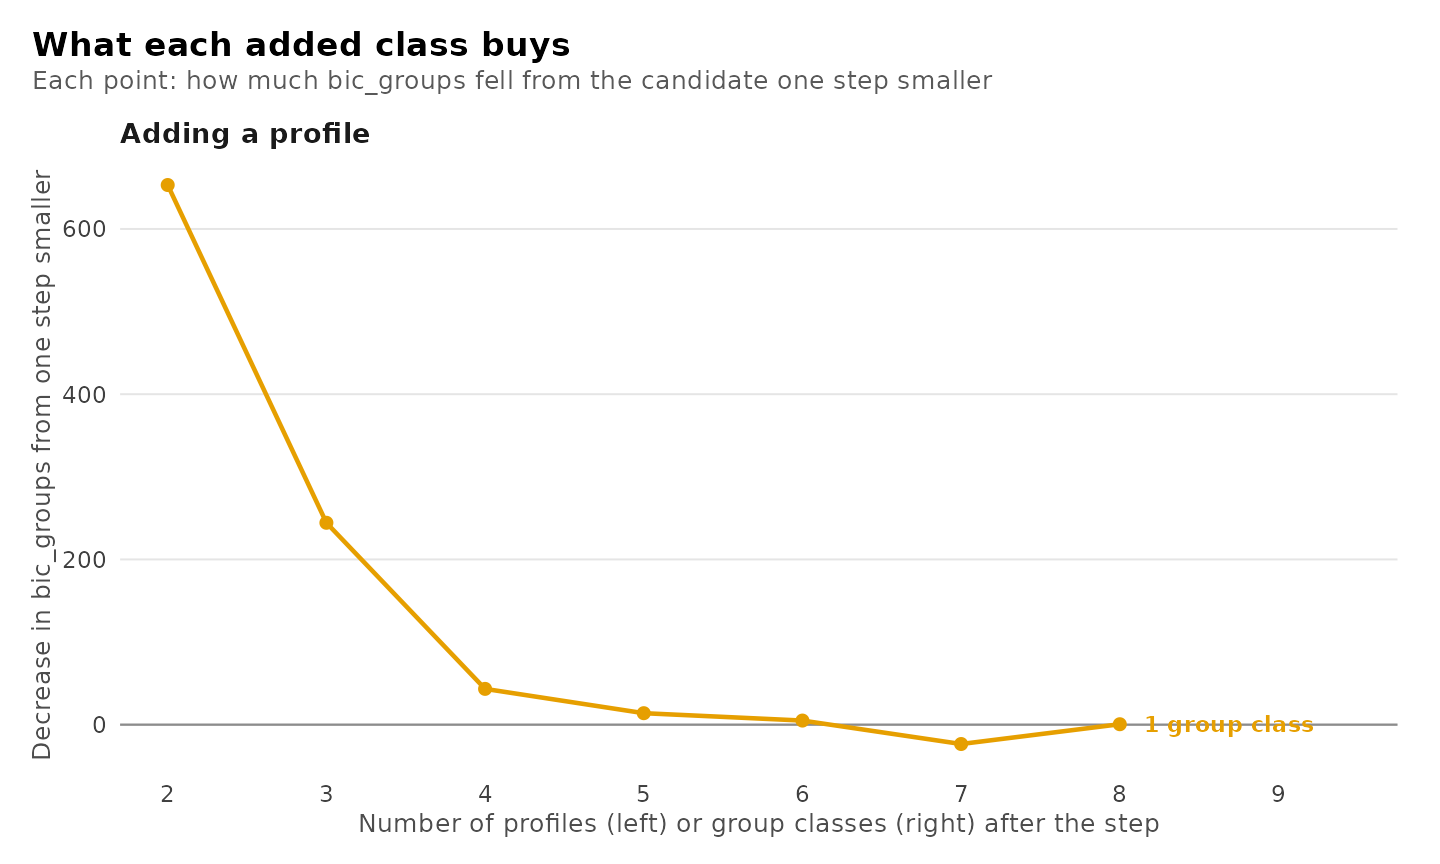
BIC is minimized by profiles6. The eight-profile candidate has a
variance at its lower bound and a nearly empty profile, which marks the
limit of what 300 observations can support. The two warnings issued
during the enumeration originate from this candidate and are retained in
the warnings column of the table.
Missing values and scaled indicators
Two arguments alter the data to which the candidates are fitted and,
like n_starts, apply to all candidates. With
missing = "fiml", rows with some indicators missing
contribute through the indicators observed (full information maximum
likelihood); rows with every indicator missing are excluded from the
individual sample size, entropy and AvePP, since they carry no
information on class membership. centering subtracts and
scaling divides by a mean or standard deviation computed
over the sample ("grand") or within each group
("person"); combined, they yield grand or within-person
z-scores. Information criteria are comparable only among candidates
fitted under the same settings. Model
selection describes both with examples.
Multiple covariance structures
Specifying several structures in model multiplies the
candidates, and the structure is appended to each name. Because the
numbers of classes then match several candidates, a candidate must be
specified by its full name.
crossed_models <- enumerate_lpa(srl, c("cognitive_strategies",
                                       "intrinsic_value", "self_efficacy",
                                       "self_regulation", "test_anxiety"),
                                n_profiles = 2:4, model = c("VVI", "EEE"),
                                n_starts = 5, seed = 1)
crossed_models
#> Class enumeration: 6 candidate models
#>      candidate n_profiles n_group_classes model log_likelihood n_parameters  aic bic_groups
#>  profiles2_VVI          2               1   VVI           -889           21 1821       1898
#>  profiles3_VVI          3               1   VVI           -736           32 1535       1654
#>  profiles4_VVI          4               1   VVI           -683           43 1451       1611
#>  profiles2_EEE          2               1   EEE           -601           26 1254       1350
#>  profiles3_EEE          3               1   EEE           -593           32 1250       1369
#>  profiles4_EEE          4               1   EEE           -583           38 1242       1383
#>  bic_individual icl_individual profile_entropy group_entropy avepp_min avepp_max avepp_mean
#>            1898           1940           0.899            NA     0.969     0.979      0.974
#>            1654           1714           0.909            NA     0.936     0.975      0.959
#>            1611           1728           0.859            NA     0.885     0.954      0.917
#>            1350           1457           0.744            NA     0.880     0.954      0.917
#>            1369           1596           0.656            NA     0.795     0.890      0.839
#>            1383           1574           0.771            NA     0.829     0.949      0.884
#>  avepp_below group_avepp_min group_avepp_max group_avepp_mean group_avepp_below converged boundary
#>            0              NA              NA               NA                NA      TRUE    FALSE
#>            0              NA              NA               NA                NA      TRUE    FALSE
#>            0              NA              NA               NA                NA      TRUE    FALSE
#>            0              NA              NA               NA                NA      TRUE    FALSE
#>            1              NA              NA               NA                NA      TRUE    FALSE
#>            0              NA              NA               NA                NA      TRUE    FALSE
#>  n_best_replicated
#>                  5
#>                  5
#>                  3
#>                  5
#>                  1
#>                  2
#> No candidate is selected automatically. Compare one convention consistently.
compare_models(crossed_models, "profiles3_VVI", "profiles3_EEE")
#> Model comparison
#>
#> Model          Profiles   k   LogLik      BIC    ΔBIC  Weight      ICL  Entropy  Min AvePP  < 0.8
#> -------------  --------  --  -------  -------  ------  ------  -------  -------  ---------  -----
#> profiles3_VVI         3  32  -735.74  1654.00  284.98   0.000  1714.03     0.91       0.94      0
#> profiles3_EEE         3  32  -593.25  1369.02    0.00   1.000  1595.94     0.66       0.79      1
Latent transition models
With time, every candidate is a latent transition model
over the occasions, here the order of each student’s enrolments in
sequence. The six-profile model requires more than the
default 1,000 EM iterations to meet the convergence tolerance, so
max_iter is increased.
transition_models <- enumerate_classes(course_engagement, activity, "student",
                                       time = "sequence", n_profiles = 2:6,
                                       n_group_classes = 1, n_starts = 3,
                                       max_iter = 2000, seed = 1)
transition_models
#> Transition-model enumeration: 5 candidates
#>          candidate n_profiles n_group_classes model log_likelihood n_parameters   bic   aic entropy
#>  profiles2_groups1          2               1  <NA>          -8335           23 16778 16717  0.9611
#>  profiles3_groups1          3               1  <NA>          -8262           38 16701 16600  0.8006
#>  profiles4_groups1          4               1  <NA>          -8219           55 16695 16548  0.7352
#>  profiles5_groups1          5               1  <NA>          -8195           74 16736 16538  0.7793
#>  profiles6_groups1          6               1  <NA>          -8180           95 16804 16551  0.7017
#>  converged boundary
#>       TRUE    FALSE
#>       TRUE    FALSE
#>       TRUE    FALSE
#>       TRUE    FALSE
#>       TRUE    FALSE
#> Pick one by its name: get_candidate(x, "<candidate>").
compare_models(transition_models)
#> Model comparison
#>
#> Model              Profiles   k    LogLik       BIC    ΔBIC  Weight       ICL  Entropy  Min AvePP  < 0.8
#> -----------------  --------  --  --------  --------  ------  ------  --------  -------  ---------  -----
#> profiles2_groups1         2  23  -8335.29  16777.83   83.11   0.000  16914.15     0.96       0.99      0
#> profiles3_groups1         3  38  -8261.98  16701.16    6.43   0.039  17422.93     0.80       0.85      0
#> profiles4_groups1         4  55  -8219.12  16694.73    0.00   0.961  17881.71     0.74       0.82      0
#> profiles5_groups1         5  74  -8195.25  16735.59   40.86   0.000  17937.96     0.78       0.81      0
#> profiles6_groups1         6  95  -8180.49  16804.01  109.28   0.000  18570.64     0.70       0.69      4
Functions
| Call | Result |
|---|---|
| enumerate_classes(data, vars, id, n_profiles, n_group_classes, model) | The fitted candidate models |
| enumerate_classes(…, n_starts = , missing = “fiml”, centering = , scaling = ) | The same starts, missing-data handling, centring and scaling for every candidate |
| enumerate_classes(…, boundary = “exclude”) | Starts with a variance at its lower bound set aside for every candidate |
| as.data.frame(models) | One row per candidate with every column |
| get_results(models, “best”) | The candidate at the minimum of each criterion |
| get_results(models, “classification”) | Size, AvePP and entropy of every class of every candidate |
| get_results(models, “candidates”, cutoff = 0.9) | The table of candidates with another AvePP cutoff |
| get_results(models, “deltas”, using = ) | Decrease in a criterion from one profile fewer and one group class fewer |
| get_results(models, “knees”, using = ) | Maximum chord-distance knee of each line, its range and its stability |
| plot_enumeration(models), plot_enumeration(models, what = “bic_groups”), what = “all” | Information criteria across the candidates |
| plot_tree(models) | Division of profiles as more are added |
| plot_enumeration(models, what = “entropy”, “avepp” or “diagnostics”, cutoff = ) | Entropy and lowest AvePP across the candidates |
| plot_selection(models, what = “deltas”, “heatmap”, “smallest” or “trust”, using = ) | Decreases, distance from the lowest criterion, smallest class, estimation checks |
| plot_selection(models) | All of the plots for choosing the number of classes |
| get_candidate(models, “profiles4_groups3”), get_candidate(models, 4, 3) | One fitted candidate |
| compare_models(models, “name”, c(4, 2), …) | Named candidates side by side |
| compare_models(models, n_profiles = , n_group_classes = ) | All candidates with the given numbers of classes |
| compare_models(name = fit, name = fit) | Fitted models side by side, on the same data |
| get_candidate(comparison, “name”) | The model behind a row of a comparison |
| get_results(comparison, “classification”) | Every class of every compared model |
References
Akaike, H. (1974). A new look at the statistical model identification. IEEE Transactions on Automatic Control, 19, 716–723.
Banfield, J. D., & Raftery, A. E. (1993). Model-based Gaussian and non-Gaussian clustering. Biometrics, 49, 803–821.
Biernacki, C., Celeux, G., & Govaert, G. (2000). Assessing a mixture model for clustering with the integrated completed likelihood. IEEE Transactions on Pattern Analysis and Machine Intelligence, 22, 719–725.
Bolck, A., Croon, M., & Hagenaars, J. (2004). Estimating latent structure models with categorical variables: One-step versus three-step estimators. Political Analysis, 12, 3–27.
Davison, A. C., & Hinkley, D. V. (1997). Bootstrap methods and their application. Cambridge University Press.
Lukočienė, O., Varriale, R., & Vermunt, J. K. (2010). The simultaneous decision(s) about the number of lower- and higher-level classes in multilevel latent class analysis. Sociological Methodology, 40, 247–283.
McLachlan, G. J. (1987). On bootstrapping the likelihood ratio test statistic for the number of components in a normal mixture. Applied Statistics, 36, 318–324.
McLachlan, G. J., & Peel, D. (2000). Finite mixture models. Wiley.
Nagin, D. S. (2005). Group-based modeling of development. Harvard University Press.
Nylund, K. L., Asparouhov, T., & Muthén, B. O. (2007). Deciding on the number of classes in latent class analysis and growth mixture modeling: A Monte Carlo simulation study. Structural Equation Modeling, 14, 535–569.
Ramaswamy, V., DeSarbo, W. S., Reibstein, D. J., & Robinson, W. T. (1993). An empirical pooling approach for estimating marketing mix elasticities with PIMS data. Marketing Science, 12, 103–124.
Satopää, V., Albrecht, J., Irwin, D., & Raghavan, B. (2011). Finding a “kneedle” in a haystack: Detecting knee points in system behavior. In 31st International Conference on Distributed Computing Systems Workshops (pp. 166–171). IEEE.
Schwarz, G. (1978). Estimating the dimension of a model. The Annals of Statistics, 6, 461–464.
Vermunt, J. K. (2003). Multilevel latent class models. Sociological Methodology, 33, 213–239.
Vermunt, J. K. (2010). Latent class modeling with covariates: Two improved three-step approaches. Political Analysis, 18, 450–469.
Wagenmakers, E.-J., & Farrell, S. (2004). AIC model selection using Akaike weights. Psychonomic Bulletin & Review, 11, 192–196.
Zappia, L., & Oshlack, A. (2018). Clustering trees: A visualization for evaluating clusterings at multiple resolutions. GigaScience, 7(7), giy083.