Fits a single-level latent profile model: a finite mixture of multivariate
normal distributions, in which each observation belongs to one of
n_profiles unobserved profiles and each profile has its own mean on every
indicator. It is the model multilpa() fits with id = NULL, and it
returns the same object, so every accessor, plot and inference verb of the
package applies to it.
Arguments
- data
A data frame with one row per observation.
- vars
Names of the indicator columns. Numeric columns are continuous indicators; name categorical ones in
categorical.- n_profiles
Number of profiles, a positive whole number.
- ...
Further arguments for
multilpa(): the covariance structure (variance_model,covariance_model, orvolume,shape,orientation),missing,categorical,n_starts,seed,prior,noise,profile_covariatesand the others it documents, exceptidandn_group_classes, which a single-level model does not have.
Value
A fitted multilpa object, as multilpa() returns.
Details
For observations nested in groups (students in schools, occasions in
persons), use multilpa() with the grouping column as id, which adds
latent classes of groups above the profiles.
Conditions
latents_bad_argument when id or n_group_classes is passed; the
conditions multilpa() raises otherwise.
References
Oberski, D. (2016). Mixture models: Latent profile and latent class analysis. In J. Robertson & M. Kaptein (Eds.), Modern Statistical Methods for HCI (pp. 275–287). Springer.
See also
lca() for categorical indicators; multilpa() for the two-level
model; enumerate_lpa() to compare numbers of profiles.
Examples
fit <- lpa(srl, c("cognitive_strategies", "intrinsic_value",
                  "self_efficacy", "self_regulation", "test_anxiety"),
           n_profiles = 2, variance_model = "equal",
           covariance_model = "full", n_starts = 3, seed = 1)
fit
#> Latent profile analysis: 2 profiles
#> 300 observations; equal full residual covariance (EEE)
#> Log likelihood: -600.924999 | AIC: 1253.850 | BIC: 1350.148
#> Converged: TRUE | iterations: 18 | best start: 1/3
#>
#>  profile cognitive_strategies intrinsic_value self_efficacy self_regulation
#>        1             5.215480        5.515915      5.392216        5.108061
#>        2             5.928344        6.386346      6.166524        5.740191
#>  test_anxiety     count proportion
#>      3.845232  93.07442  0.3102481
#>      3.634675 206.92558  0.6897519
#>
#> Variances and standard errors: get_results(x, "profiles").
#> Every other table: get_results(x, what = ), or get_results(x, "all").
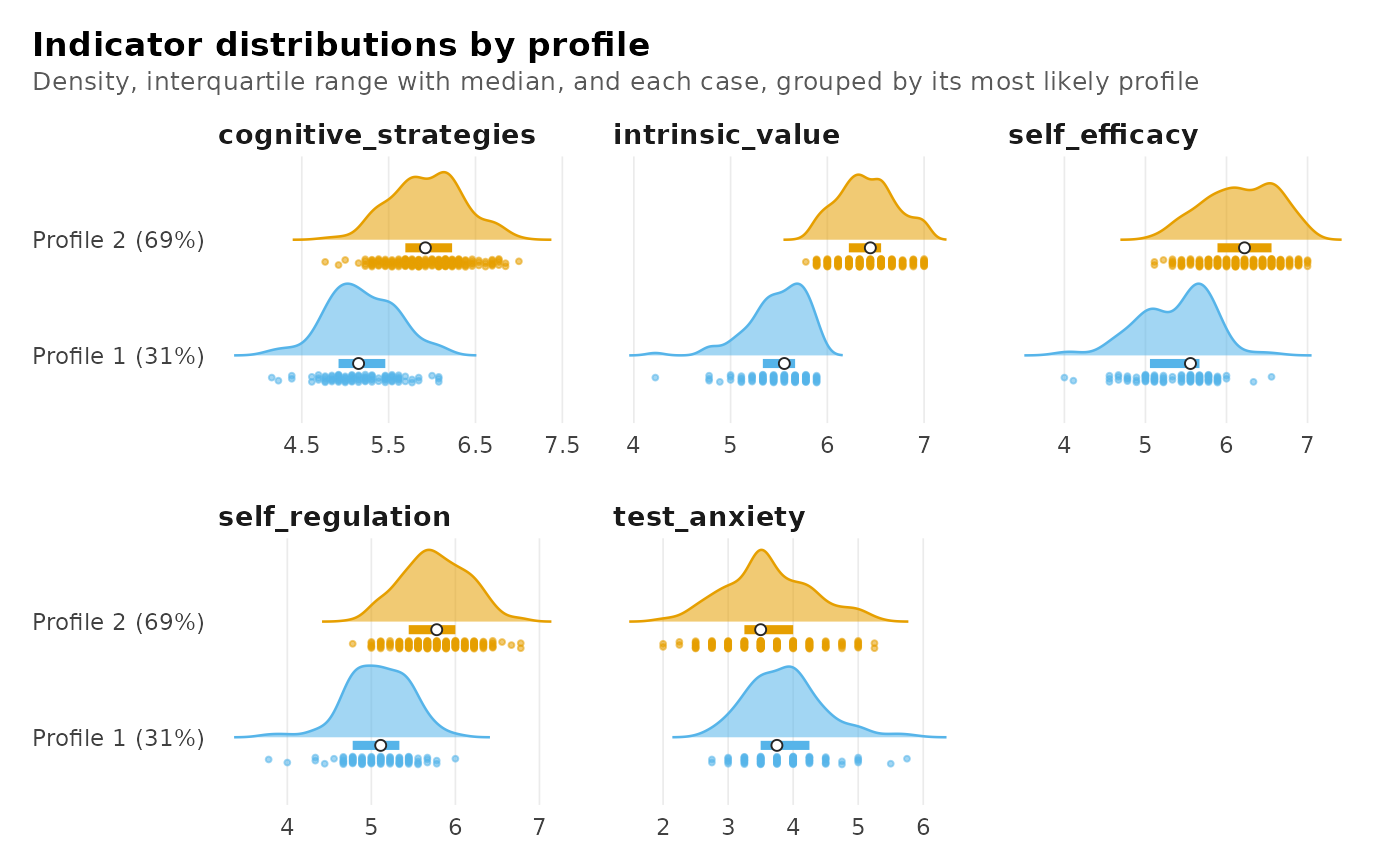
plot(fit, what = "raincloud")