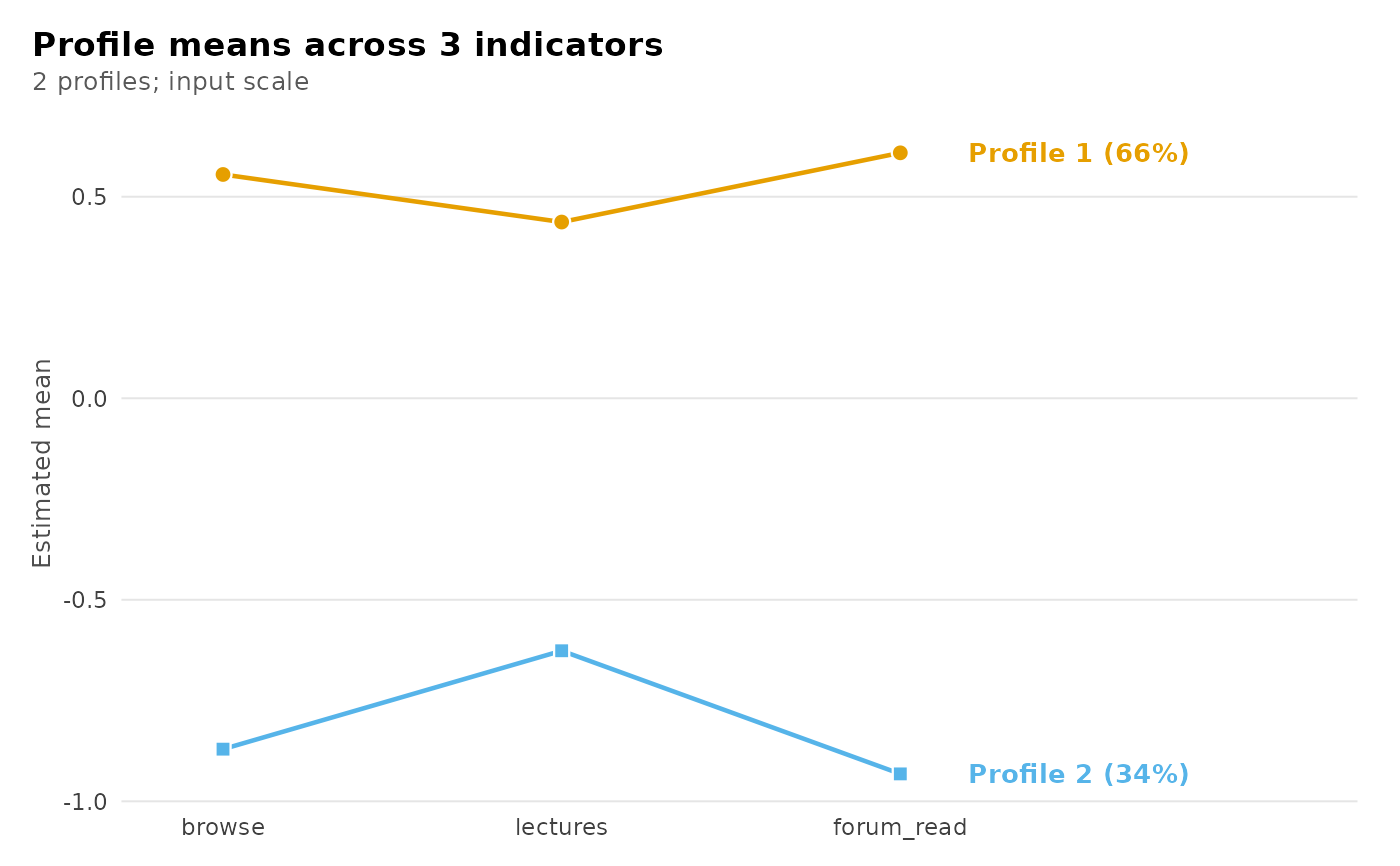
The measurement model is the one multilpa() fits, so every measurement and
classification view it draws is available here. what = "transitions" is the
view this family adds: the estimated transition matrix, one panel per group
class, with a row that has no data support labelled in parentheses because
it is uniform by construction rather than estimated.
Usage
# S3 method for class 'multilpa_transitions'
plot(
  x,
  what = c("transitions", "profiles", "bars", "heatmap", "responses", "sequences",
    "sizes", "entropy", "posteriors", "avepp", "all"),
  data = NULL,
  scale = c("raw", "standardized"),
  category = "last",
  labels = TRUE,
  cell_labels = TRUE,
  main = NULL,
  subtitle = NULL,
  ...
)
Arguments
- x
A fitted
multilpa_transitionsmodel.- what
The view to draw.
"transitions"draws the estimated transition matrix, one panel per group class."profiles","bars"and"heatmap"draw the measurement model,"responses"the categorical response curves,"sequences"each group's profile at each occasion, and"sizes","entropy","posteriors"and"avepp"the classification diagnostics."all"returns every view this fit has the ingredients for.- data
Optional. Accepted for consistency with
plot.multilpa(); this family's views draw point estimates, andparameter_inference()reports the standard errors.- scale
"raw"keeps the indicators in their own units;"standardized"divides by each indicator's observed standard deviation.- category
For
"responses", which category to draw.- labels
Whether to label series directly.
- cell_labels
For
"sequences", whether to print the profile number in each cell.- main, subtitle
Title and subtitle.
NULLuses the view's own.- ...
Nothing further is accepted; an unknown argument raises an error of class
latents_bad_argument.
See also
get_tna() and get_group_tna() to draw the transitions as a
network instead, and plot.multilpa() for the same views on a
cross-sectional fit.