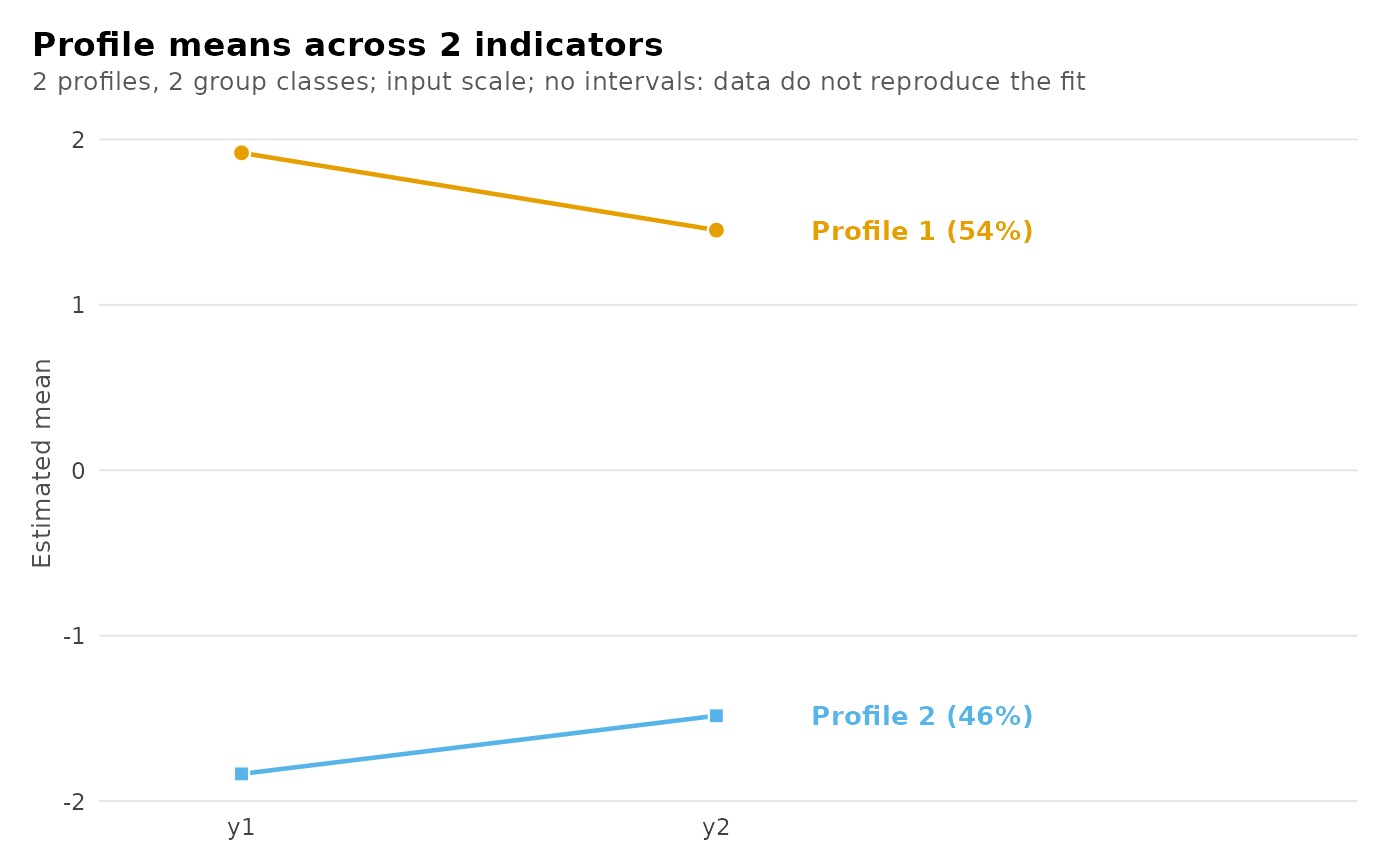
Draws the parts of a covariate fit that are still fixed quantities: the
measurement model, the assignments and the classification diagnostics, as
plot.multilpa() draws them. Profile prevalence cannot be drawn: a
covariate model has no single prevalence vector, because prevalence varies
with each unit's covariates, so asking for it is refused rather than
answered with an average that no unit has.
Usage
# S3 method for class 'multilpa_covariates'
plot(
  x,
  what = c("profiles", "bars", "heatmap", "raincloud", "parallel", "pairs", "responses",
    "sequences", "sizes", "entropy", "posteriors", "avepp", "all"),
  data = NULL,
  scale = c("raw", "standardized"),
  category = "last",
  labels = TRUE,
  intervals = TRUE,
  cell_labels = TRUE,
  main = NULL,
  subtitle = NULL,
  statistic = c("mean", "median", "mode"),
  ...
)
Arguments
- x
A fitted
multilpa_covariatesmodel.- what
The view; every view of
plot.multilpa()except"probabilities".- data, scale, category, labels, intervals, cell_labels, main, subtitle, statistic, ...
As in
plot.multilpa().
Examples
if (requireNamespace("ggplot2", quietly = TRUE)) {
  set.seed(5)
  school <- rep(seq_len(16), each = 8)
  high_class <- rep(rep(c(FALSE, TRUE), length.out = 16), each = 8)
  x <- rnorm(128)
  profile <- ifelse(
    runif(128) < plogis(-1 + 2 * high_class + 0.8 * x), 2L, 1L
  )
  example_data <- data.frame(
    school = school, x = x,
    y1 = rnorm(128, ifelse(profile == 2L, 2, -2), 0.7),
    y2 = rnorm(128, ifelse(profile == 2L, 1.5, -1.5), 0.7)
  )
  fit <- multilpa(example_data, c("y1", "y2"), "school", n_profiles = 2,
                  n_group_classes = 2, profile_covariates = "x",
                  n_starts = 2)
  plot(fit)
}