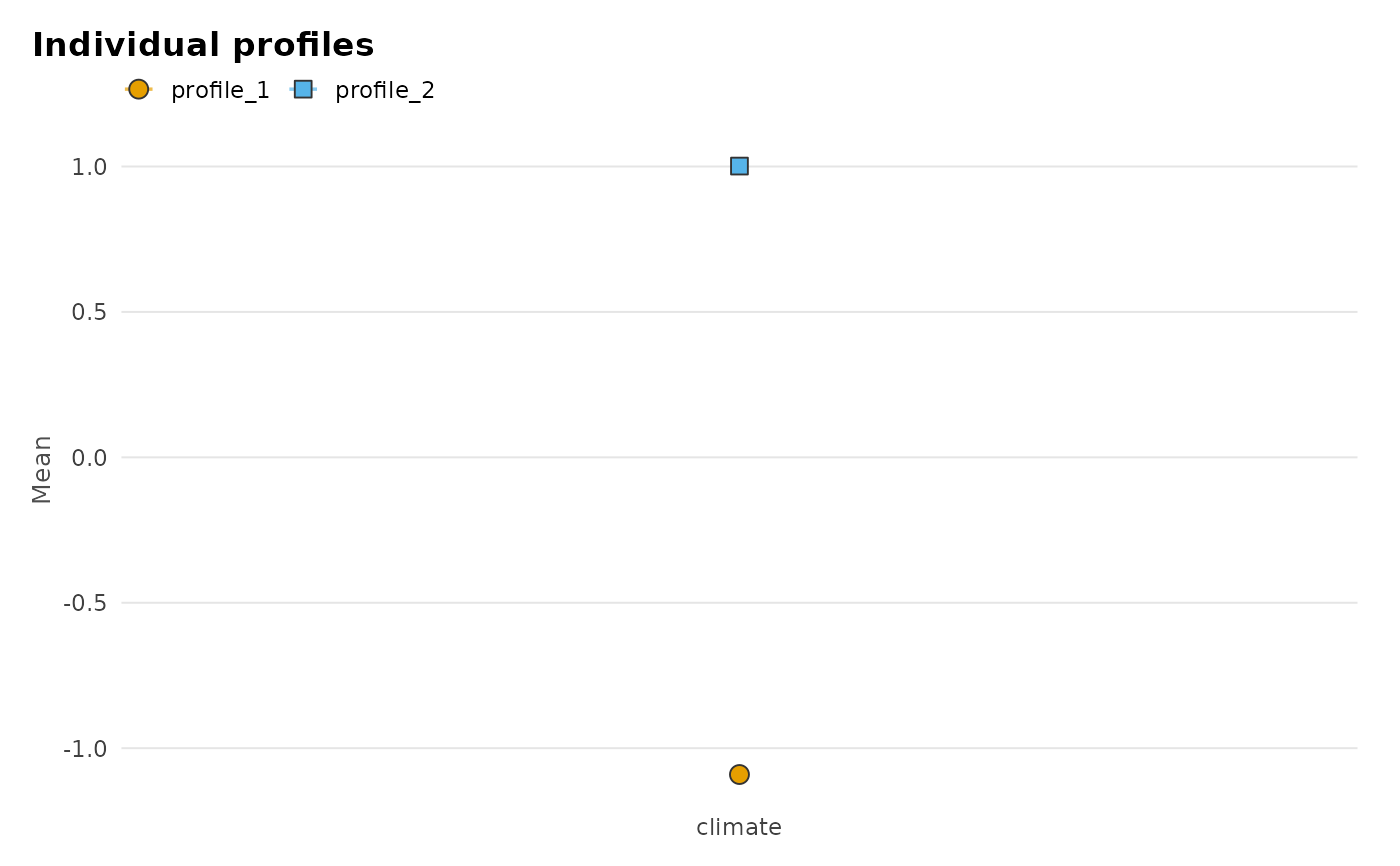
"profiles" shows the individual profiles' means per indicator;
"group_means" the group classes' means of the group means;
"composition" the profile shares within each group class. Profiles and
classes are told apart by colour and point shape.
Examples
set.seed(1)
ratings <- data.frame(
  team = rep(seq_len(40), each = 6),
  climate = rep(rnorm(40, rep(c(-1, 1), each = 20), 0.5), each = 6) +
    rnorm(240, sample(c(-1, 1), 240, replace = TRUE), 0.6))
fit <- multilpa(ratings, "climate", "team", n_profiles = 2,
                n_group_classes = 2, family = "full_cross_level",
                n_starts = 3, seed = 1)
if (requireNamespace("ggplot2", quietly = TRUE)) plot(fit)
#> `geom_line()`: Each group consists of only one observation.
#> ℹ Do you need to adjust the group aesthetic?