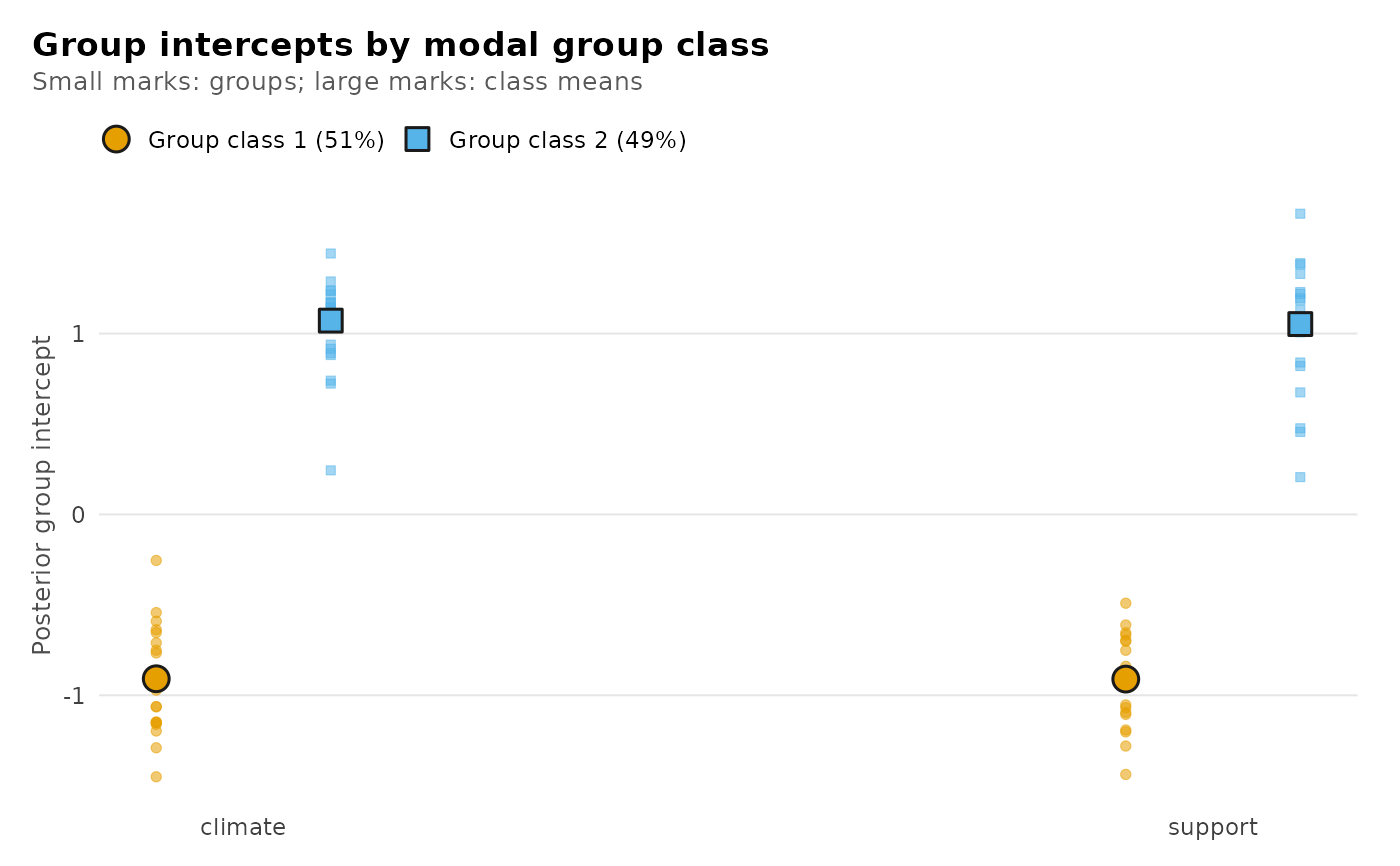
"means" shows each group class's mean per indicator with its Wald
interval (when the fit supports inference). "variances" sets the shared
within-group variance beside each between-group variance. "intercepts"
shows every group's posterior intercept mean, marked by its modal class,
with the class means over them. Classes are distinguished by colour and by
point shape.
Examples
if (requireNamespace("ggplot2", quietly = TRUE)) {
  set.seed(1)
  ratings <- data.frame(
    team = rep(seq_len(40), each = 6),
    climate = rep(rnorm(40, rep(c(-1, 1), each = 20), 0.5), each = 6) +
      rnorm(240),
    support = rep(rnorm(40, rep(c(-1, 1), each = 20), 0.5), each = 6) +
      rnorm(240))
  fit <- multilpa(ratings, c("climate", "support"), "team",
                  n_group_classes = 2, family = "additive", n_starts = 3,
                  seed = 1)
  plot(fit)
  plot(fit, what = "intercepts")
}
#> Warning: Group classes supported by fewer than 50 effective groups (group_class_1: 19.7 effective of 20.4 expected groups, 96% of the information kept; group_class_2: 18.8 effective of 19.6 expected groups, 96% of the information kept). A small information share means poor separation; a small expected count means few groups. Wald intervals for class means and weights can be miscalibrated; see get_results(x, "group_classes").
#> Warning: Group classes supported by fewer than 50 effective groups (group_class_1: 19.7 effective of 20.4 expected groups, 96% of the information kept; group_class_2: 18.8 effective of 19.6 expected groups, 96% of the information kept). A small information share means poor separation; a small expected count means few groups. Wald intervals for class means and weights can be miscalibrated; see get_results(x, "group_classes").