Plot information criteria across transition models
Source:R/lta-compare.R
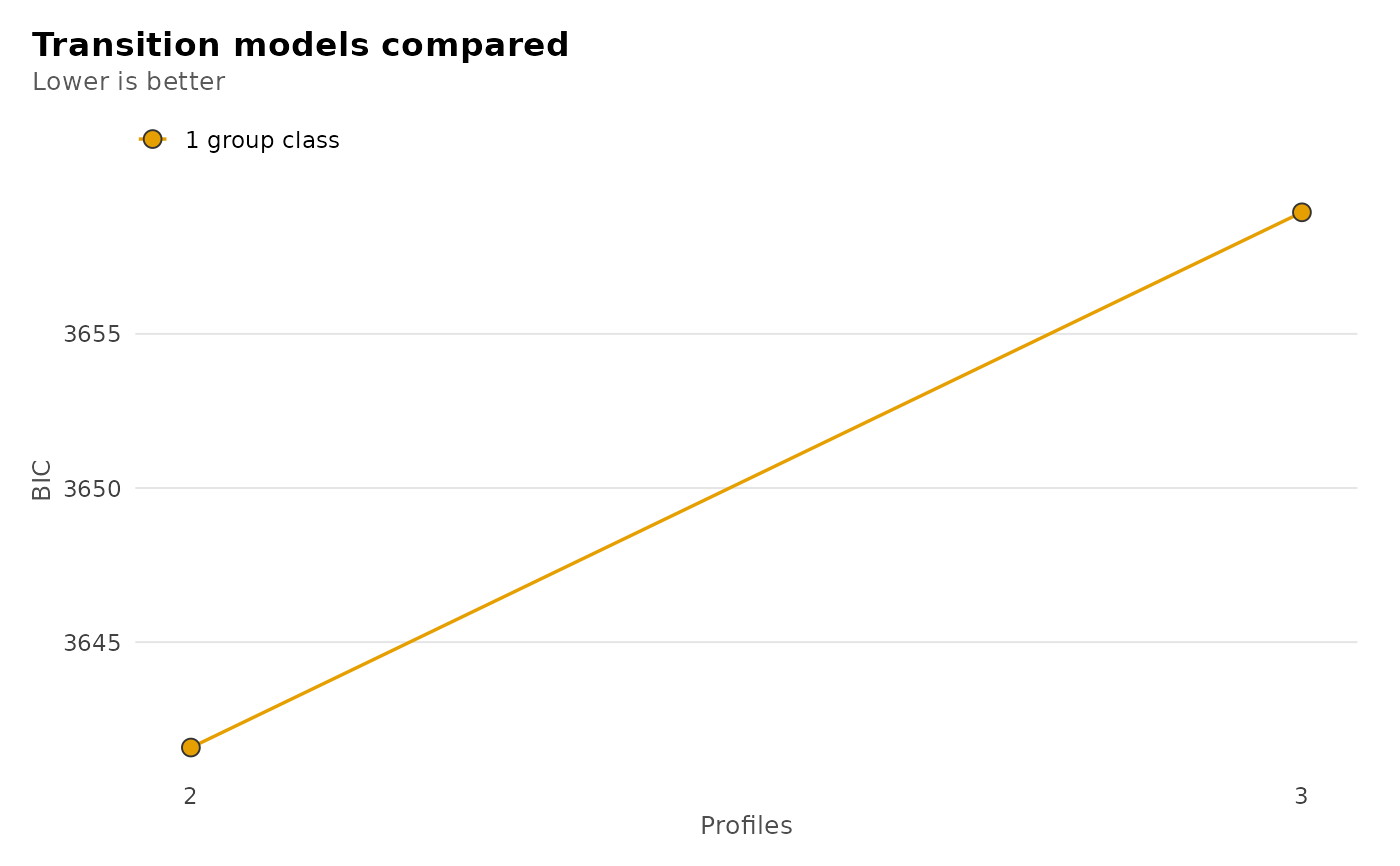
plot.latents_transition_enumeration.RdThe criterion against the number of profiles, one line per number of group classes (and structure), told apart by colour, shape and line type.
Examples
few_students <- subset(course_engagement, student <= 50)
grid <- enumerate_classes(few_students, c("browse", "lectures"),
                          "student", time = "sequence", n_profiles = 2:3,
                          n_group_classes = 1, n_starts = 2, seed = 1)
if (requireNamespace("ggplot2", quietly = TRUE)) plot(grid)