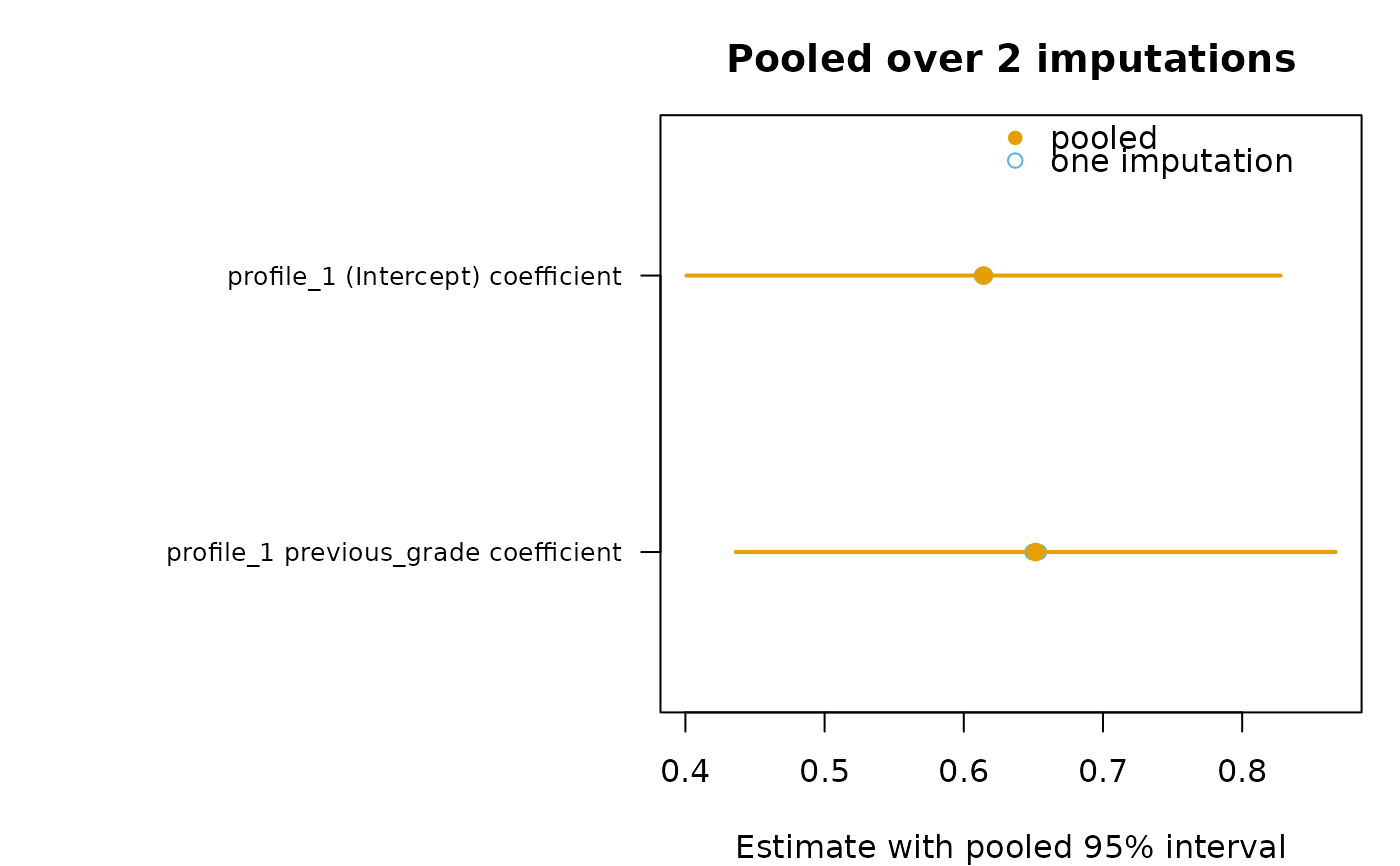
One row per parameter: each imputation's aligned estimate as an open circle and the pooled estimate as a filled circle with its interval, so the between-imputation spread is visible next to the total uncertainty.
Examples
set.seed(1)
completed <- lapply(1:2, function(i) {
  within(subset(course_engagement, student <= 40),
         previous_grade <- previous_grade + rnorm(length(previous_grade), sd = 0.1))
})
pooled <- pool_imputations(completed, c("browse", "lectures", "forum_read"),
                           "student", n_profiles = 2, n_group_classes = 1,
                           profile_covariates = "previous_grade",
                           n_starts = 2, seed = 1)
plot(pooled)