Plot a mixture-of-regressions fit
Source:R/mixture-regression-predict.R
plot.latents_mixture_regression.RdA fit that classifies persons (id with class_level = "group") is a
trajectory model, and draws the trajectory views of
plot.latents_growth_mixture() (ggplot2): "trajectories" (the
default), "individuals", "coefficients" and "classification". Any
other fit draws base-graphics views: "fitted" (the default),
"coefficients" and "posteriors".
Usage
# S3 method for class 'latents_mixture_regression'
plot(
  x,
  what = NULL,
  predictor = NULL,
  level = 0.95,
  main = NULL,
  subtitle = NULL,
  time = NULL,
  facet = FALSE,
  persons = 12L,
  max_persons = 120L,
  ...
)
Arguments
- x
A fit from
mixture_regression().- what
For a trajectory model:
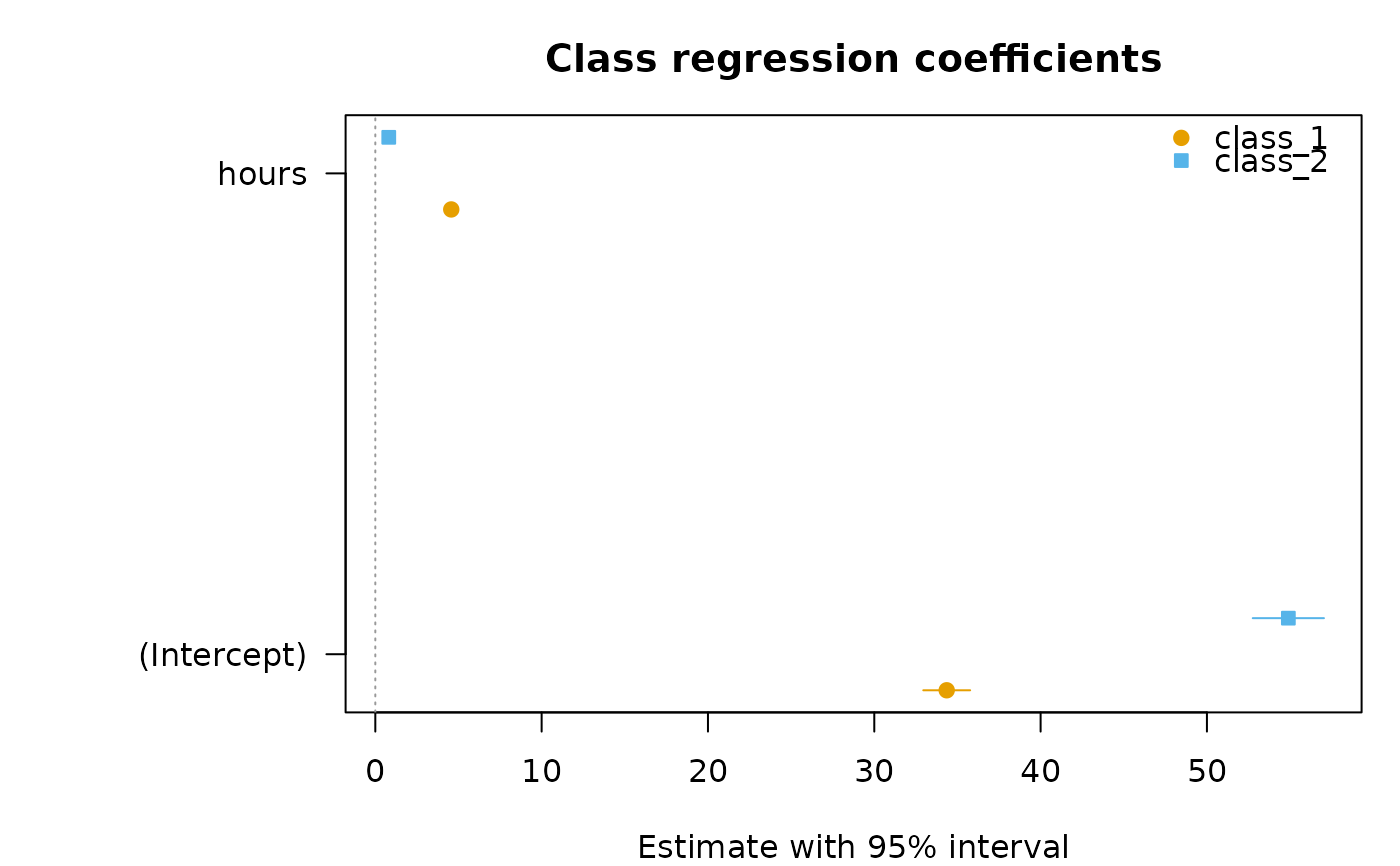
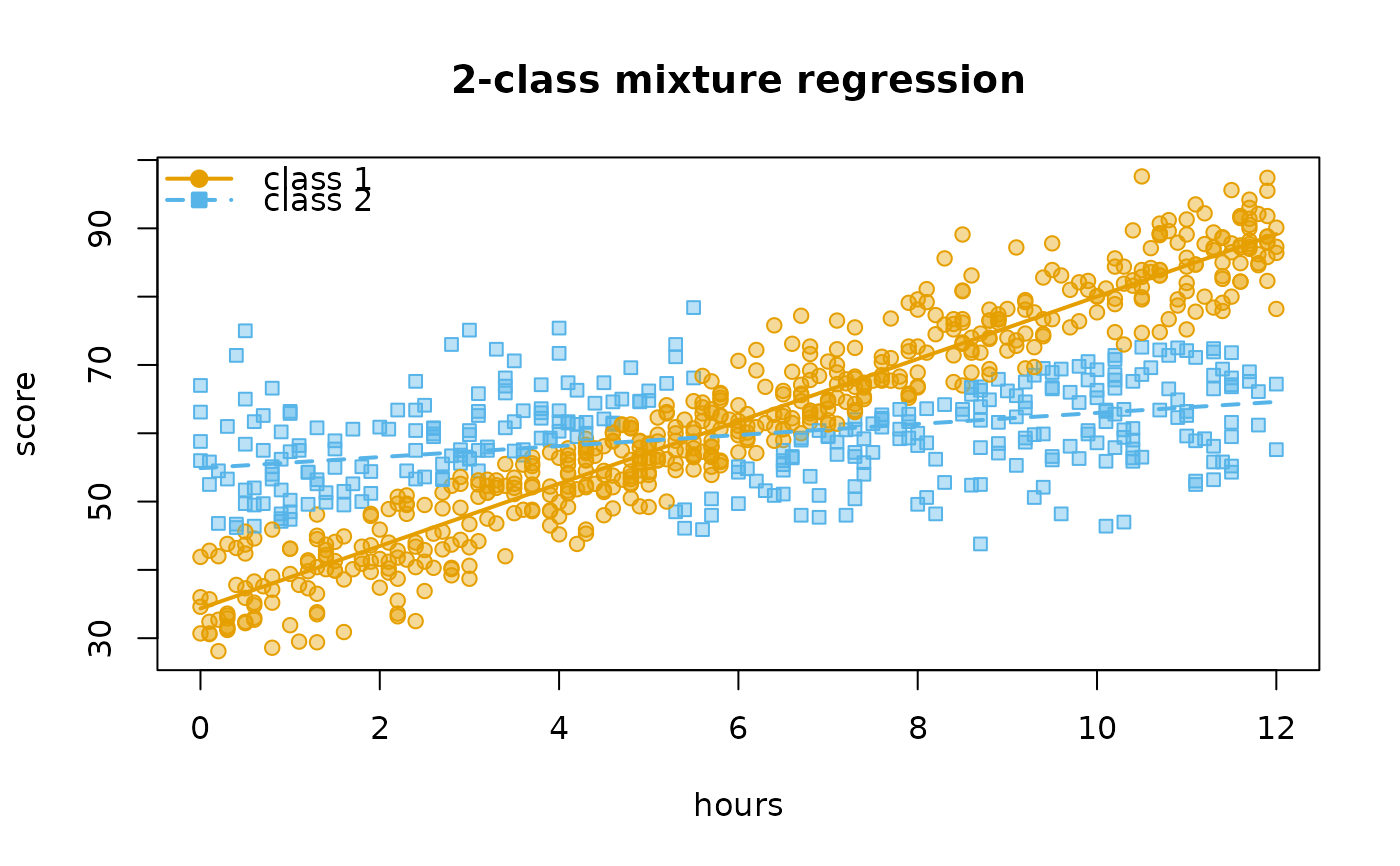
"trajectories"(each class's mean trajectory with its confidence band and the observed class means),"individuals","coefficients"(estimates with intervals and p-values) or"classification"("posteriors"is a synonym). Otherwise:"fitted"(the outcome against one numeric predictor, rows marked by modal class, each class's regression line),"coefficients"or"posteriors"(each unit's largest posterior probability, by class).- predictor
For
"fitted", the numeric predictor for the horizontal axis; defaults to the first one in the formula.- level
Confidence level of intervals and bands.
- main
Plot title;
NULLfor the default.- subtitle
For a trajectory model, the subtitle;
NULLfor the default.- time, facet, persons, max_persons
For a trajectory model, as in
plot.latents_growth_mixture().- ...
Unused.
Value
For a trajectory model, a ggplot object (raises
latents_missing_package without ggplot2); otherwise x, invisibly,
called for its plot.
Examples
fit <- mixture_regression(score ~ hours, data = study_hours, n_classes = 2,
n_starts = 3, seed = 1)
plot(fit)
 plot(fit, what = "coefficients")