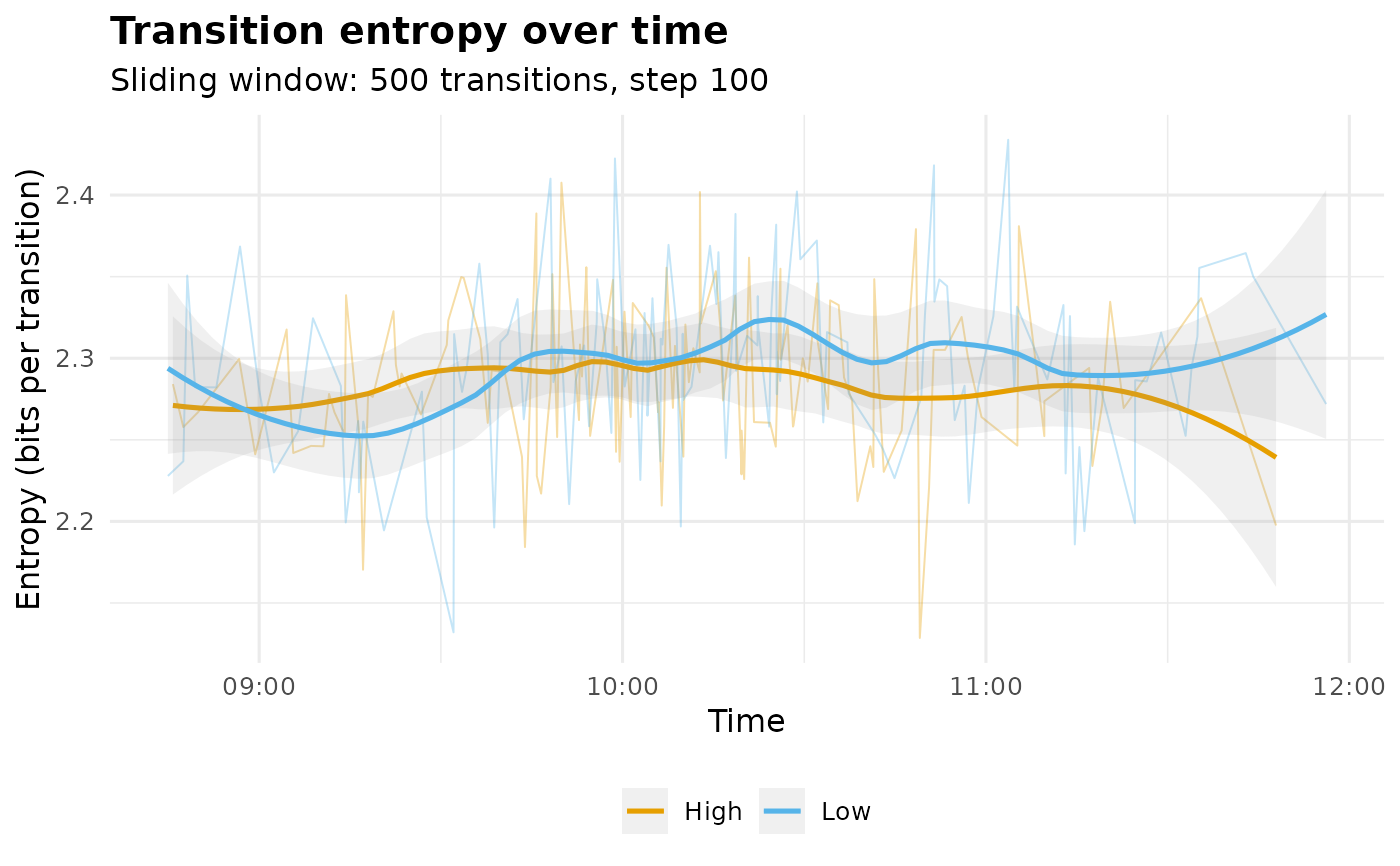
Tracks transition entropy over time: transitions are built within each actor's sequence, pooled in temporal order, and a window of fixed size slides across the stream, yielding one entropy estimate per window. This turns transition entropy from a snapshot into a process measure - declining entropy signals routinization, rising entropy exploration, and level shifts mark phase changes (cf. Krejtz et al., 2025, who track gaze transition entropy through task phases this way).
Usage
entropy_trajectory(
  data,
  action,
  actor = NULL,
  time = NULL,
  group = NULL,
  window = 500L,
  step = NULL,
  base = 2
)

# S3 method for class 'net_entropy_trajectory'
print(x, digits = 3, ...)

# S3 method for class 'net_entropy_trajectory'
summary(object, ...)

# S3 method for class 'net_entropy_trajectory'
plot(
  x,
  normalized = FALSE,
  span = 0.4,
  title = "Transition entropy over time",
  ...
)
Arguments
- data
A long-format data.frame of timestamped events.
- action
Character. Name of the column holding the state/action.
- actor
Character or NULL. Column identifying sequences; transitions are only formed between consecutive events of the same actor. NULL treats the data as one sequence.
- time
Character or NULL. Timestamp column used to order events within actors and to place windows on a real time axis. NULL keeps the row order and uses the transition index as the axis.
- group
Character or NULL. Column splitting the data into parallel trajectories (e.g. condition, achievement level).
- window
Integer. Number of transitions per window (default
500).- step
Integer. Stride between window starts (default
window %/% 5).- base
Numeric. Logarithm base (default
2, bits).- x
For the
print()andplot()methods: an object of classnet_entropy_trajectory.- digits
Integer. Digits to round numeric output. Default
3.- ...
In
plot.net_entropy_trajectory(),print.net_entropy_trajectory()andsummary.net_entropy_trajectory(): Ignored.- object
For the
summary()method: an object of classnet_entropy_trajectory.- normalized
Logical. Plot
entropy_norminstead of raw bits (defaultFALSE).- span
Numeric. Loess span (default
0.4).- title
Character. Plot title.
Value
An object of class "net_entropy_trajectory" with:
- trajectory
Tidy data.frame, one row per window:
group,window(index),time(window midpoint; transition index when notimecolumn),time_start,time_end,n_transitions,n_states(distinct states in the window),entropy(bits per transition) andentropy_norm(divided by \(\log_b\) of the window's active-state count, floored at 2 states so the ceiling is never zero; in \([0, 1]\)).- window, step, base, states
Call metadata;
statesis the global state set.
In print.net_entropy_trajectory(): x invisibly.
In summary.net_entropy_trajectory(): Tidy per-group data.frame: windows, mean/sd/min/max entropy, entropy at the first and last window, and their difference (negative = routinization).
In plot.net_entropy_trajectory(): A ggplot object.
Details
Per-window entropy is the empirical conditional entropy \(-\sum_{ij} (n_{ij}/N) \log_b(n_{ij}/n_{i\cdot})\) - rows weighted by observed occupancy rather than the eigenvector stationary distribution. Within a short window the chain is routinely non-ergodic (absorbing fragments, unvisited states), where the eigenvector is undefined or misleading; the empirical estimator is the standard windowed choice and converges to the stationary entropy rate for long stationary stretches.
Windows shorter than window at the tail are dropped; if the whole
stream is shorter than window, one window covering everything is
returned with a warning.
Methods
plot.net_entropy_trajectory(): Raw per-window entropy as faint lines with a loess-smoothed trend per group, Okabe-Ito coloured. Declining trend = routinization; level shifts = phase changes.
References
Krejtz, K., Hughes, C.J., Stasiak, I., Duchowski, A., & Krejtz, I. (2025). Real-Time Mobile Transition Matrix Entropy Based on Eye and Head Movements. ETRA '25. doi:10.1145/3715669.3723128
Cover, T.M. & Thomas, J.A. (2006). Elements of Information Theory, 2nd ed. Wiley.
See also
transition_entropy for the whole-process snapshot,
entropy_bayes for credible intervals on it.
Examples
tr <- entropy_trajectory(group_regulation_long,
                         action = "Action", actor = "Actor",
                         time = "Time", group = "Achiever")
tr
#> Entropy Trajectory (9 states; window 500 transitions, step 100)
#>
#>   High:        123 windows   mean 2.286   range [2.129, 2.408]
#>    Low:         124 windows   mean 2.296   range [2.132, 2.434]
#>
#> Use plot() for the trajectory, $trajectory for the tidy table.
summary(tr)
#>   group windows     mean         sd      min      max    first     last
#> 1  High     123 2.286338 0.04794534 2.128561 2.407602 2.241115 2.355472
#> 2   Low     124 2.295566 0.05498775 2.132020 2.433906 2.244097 2.388426
#>      change
#> 1 0.1143576
#> 2 0.1443291
plot(tr)
#> `geom_smooth()` using formula = 'y ~ x'