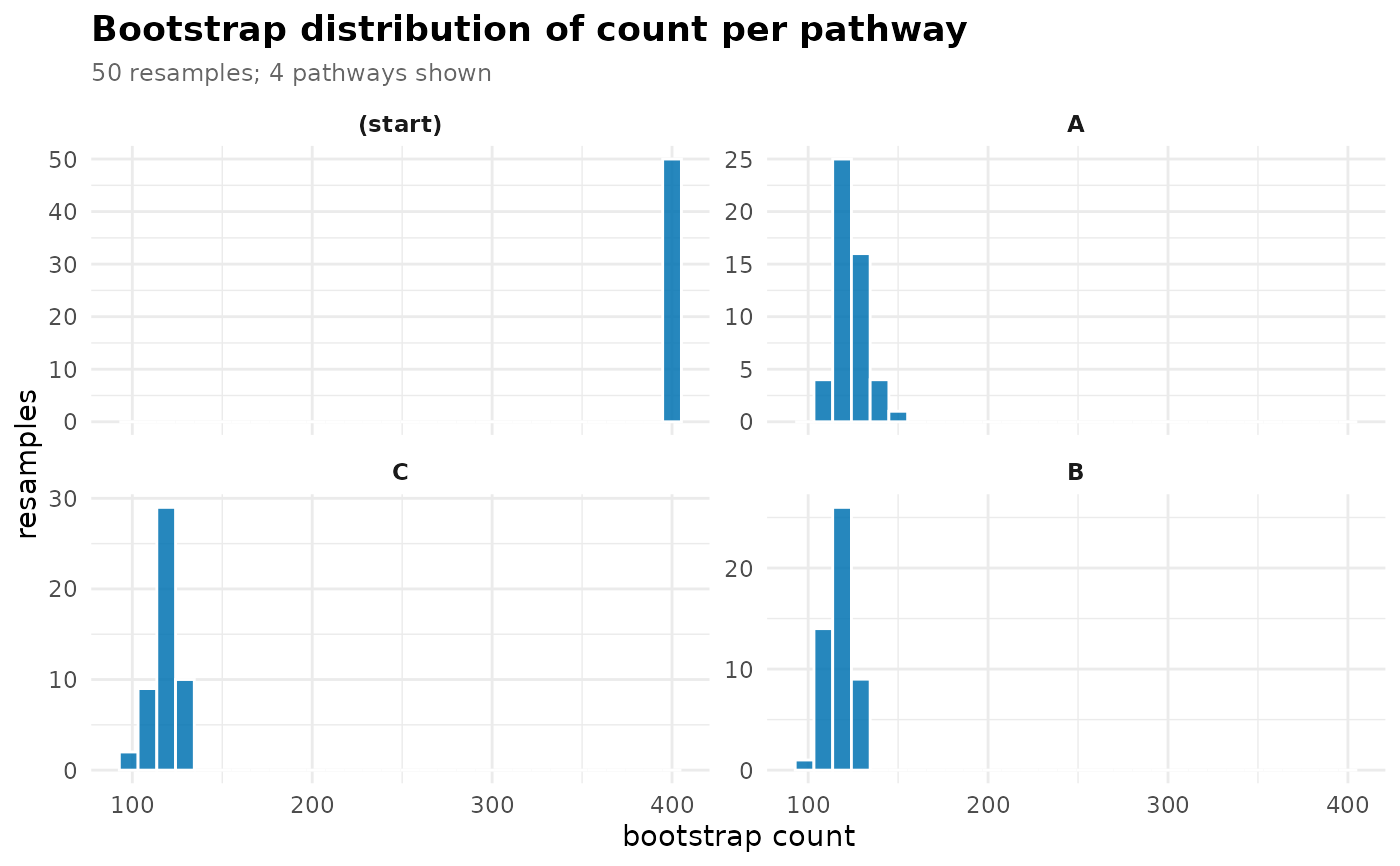
Faceted histogram of the bootstrap resample values for a chosen pathway statistic, one panel per pathway.
Usage
plot_pathway_resamples(
  x,
  pathways = NULL,
  stat = c("count", "next_probability", "divergence", "G2"),
  top = 6L,
  bins = 30L
)Examples
seqs <- replicate(40, sample(c("A", "B", "C"), 10, replace = TRUE),
                  simplify = FALSE)
boot <- bootstrap_pathways(context_tree(seqs, max_depth = 1L),
                           iter = 50L)
plot_pathway_resamples(boot, stat = "count")