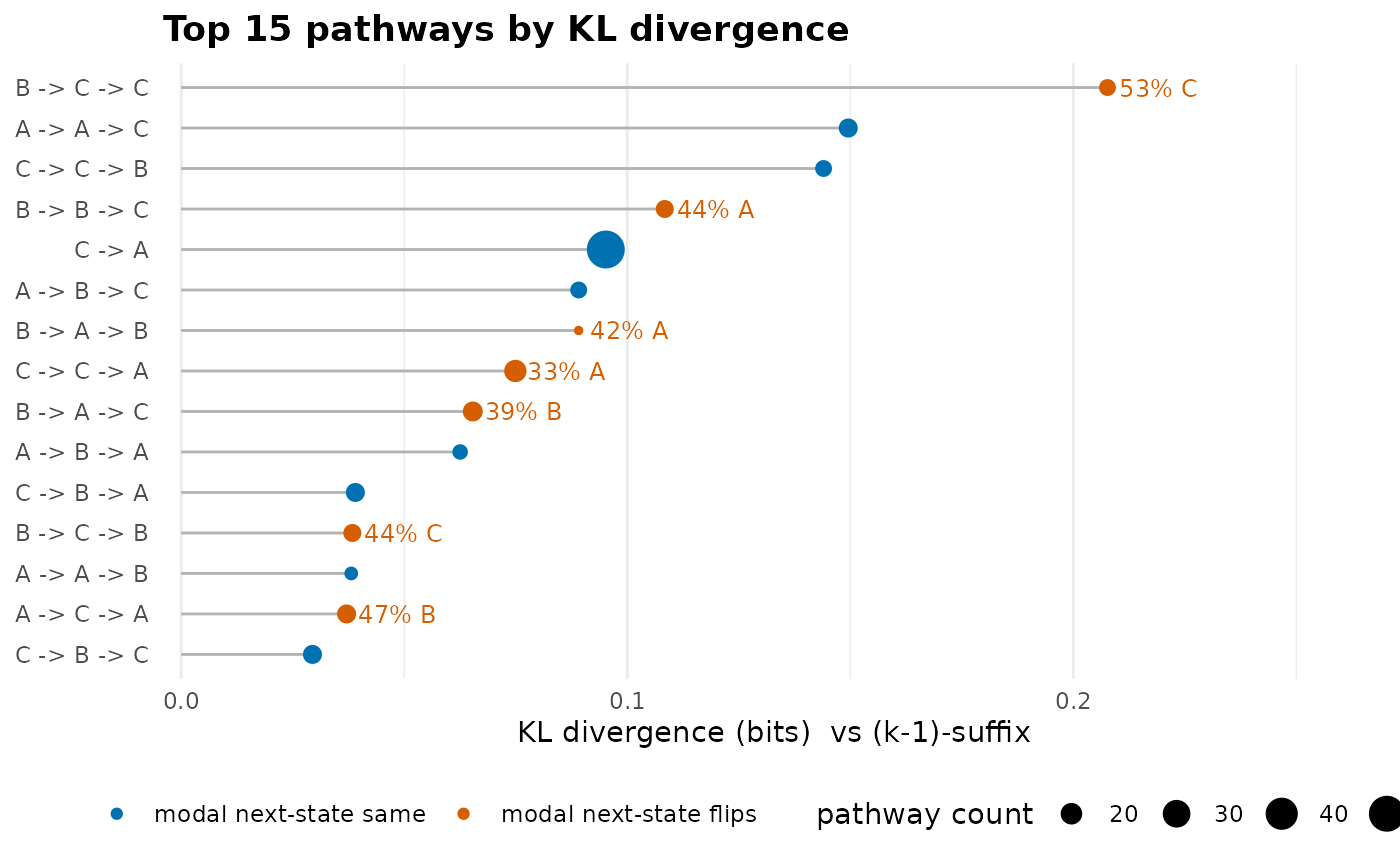
Lollipop chart of per-pathway Kullback-Leibler divergence from the (k-1)-suffix. Point size is proportional to pathway count; orange points mark pathways whose modal next state flips between orders. Annotates each flip with the prediction change, e.g. "Disengaged -> Active".
Examples
# \donttest{
seqs <- replicate(50, sample(c("A", "B", "C"), 12, replace = TRUE),
simplify = FALSE)
tree <- context_tree(seqs, max_depth = 3L)
plot_divergence(tree)
 # }
# }