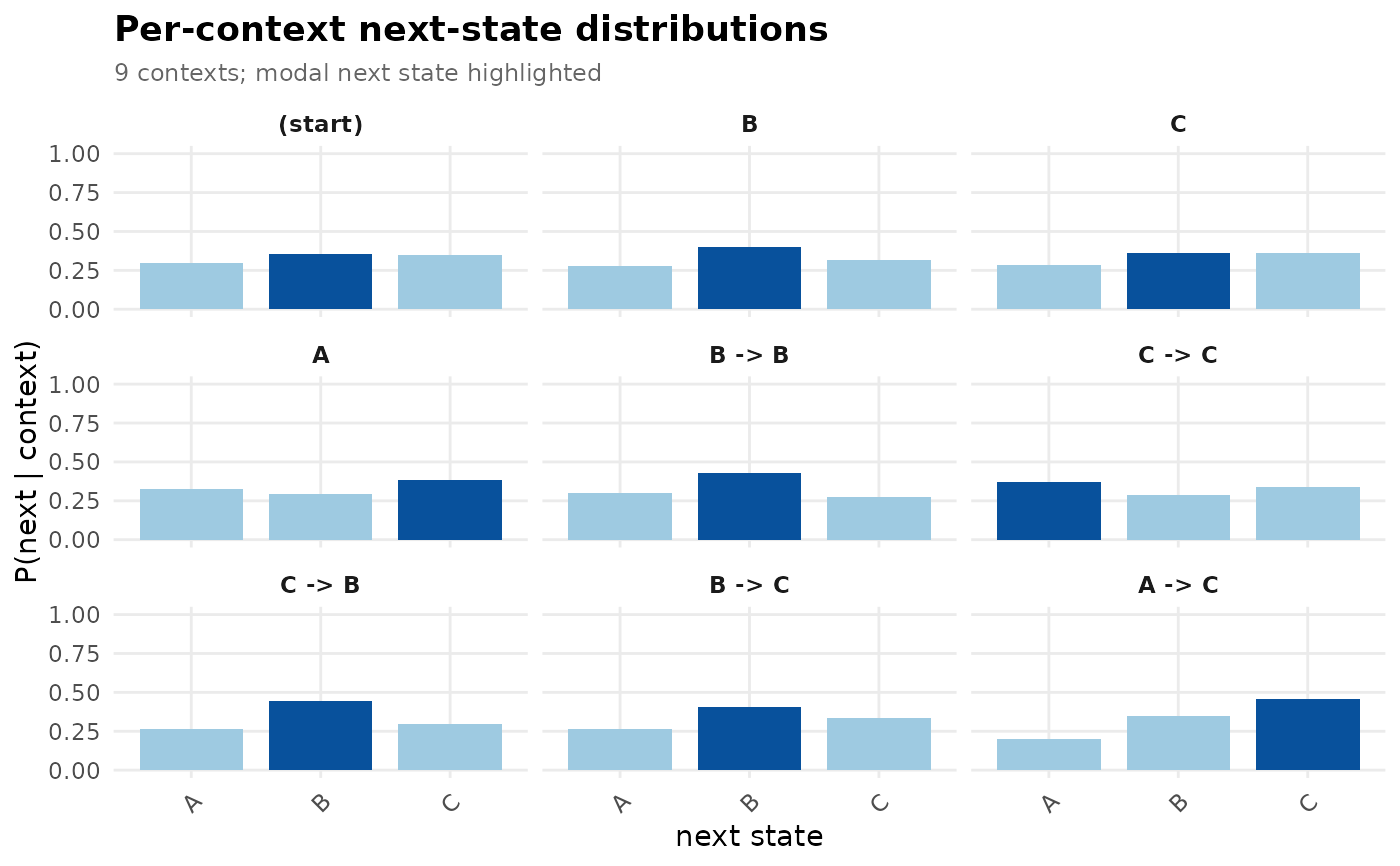
Small-multiples bar chart of the full next-state distribution
P(next | context), one panel per context. A per-context
probability display: where plot_pathways() renders the same
numbers as a heatmap, this shows each context's distribution as its
own panel, with the modal bar highlighted.
Examples
# \donttest{
seqs <- replicate(60, sample(c("A", "B", "C"), 10, replace = TRUE),
simplify = FALSE)
tree <- context_tree(seqs, max_depth = 2L)
plot_distributions(tree, top = 9)
 # }
# }