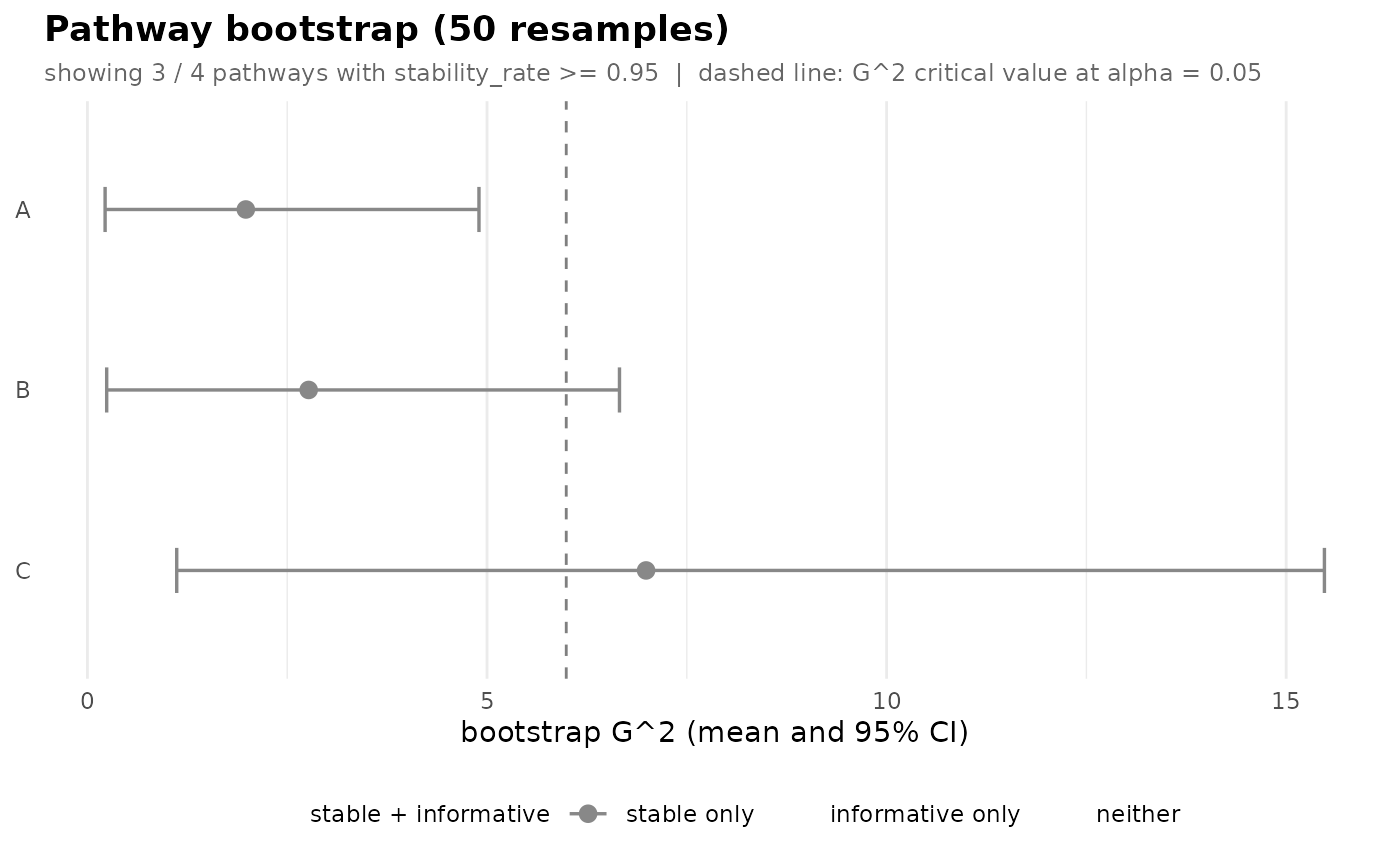
Forest plot of per-pathway \(G^2\) (likelihood-ratio against
parent) with bootstrap 95% CI bars. Pathways are ordered with
stable & informative ones first, then by stability rate.
The chi-square critical value at alpha_g2 is shown as a
dashed reference line: pathways whose CI lies entirely above it
are reproducibly informative.
Usage
# S3 method for class 'transitiontrees_bootstrap'
plot(x, top = 25L, min_stability = NULL, ...)Examples
seqs <- replicate(40, sample(c("A", "B", "C"), 10, replace = TRUE),
                  simplify = FALSE)
boot <- bootstrap_pathways(context_tree(seqs, max_depth = 1L),
                           iter = 50L)
plot(boot)
#> `height` was translated to `width`.