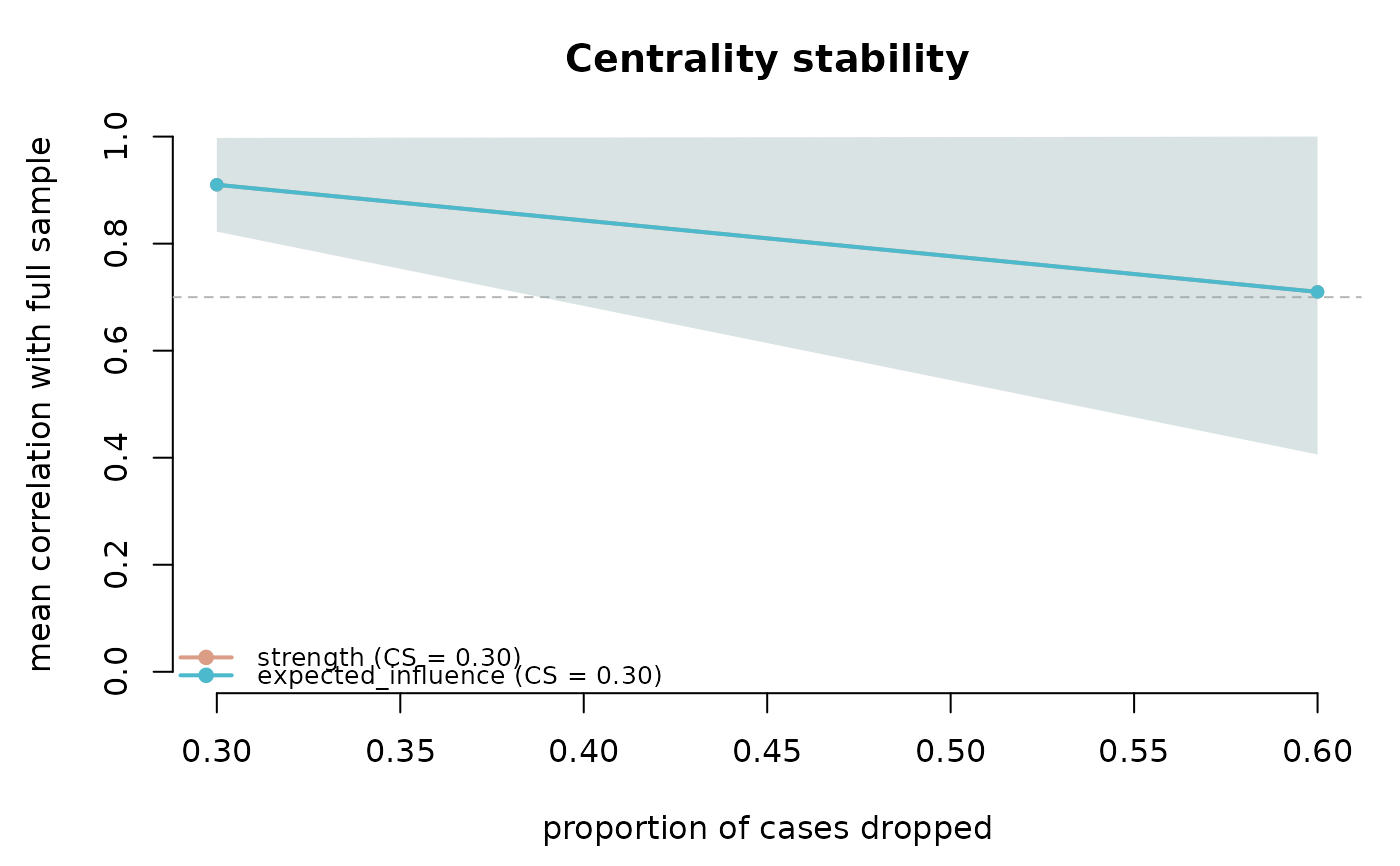
Draws the case-dropping stability curves from net_stability(): mean rank
correlation with the full-sample centrality against the proportion of cases
dropped, one line per measure, with a +/- 1 SD band, the acceptance threshold,
and the CS-coefficient annotated in the legend.
Usage
# S3 method for class 'psychnet_stability'
plot(x, ...)
Arguments
- x
A
psychnet_stabilityobject fromnet_stability().- ...
Unused.
Examples
set.seed(1)
d <- matrix(stats::rnorm(200 * 5), 200, 5) %*% chol(0.4^abs(outer(1:5, 1:5, "-")))
# method = "pcor" and small iter keep this example fast; the "glasso"
# default and iter = 100 are what a real analysis should use.
s <- net_stability(d, method = "pcor", drop_prop = c(0.3, 0.6), iter = 10)
plot(s)