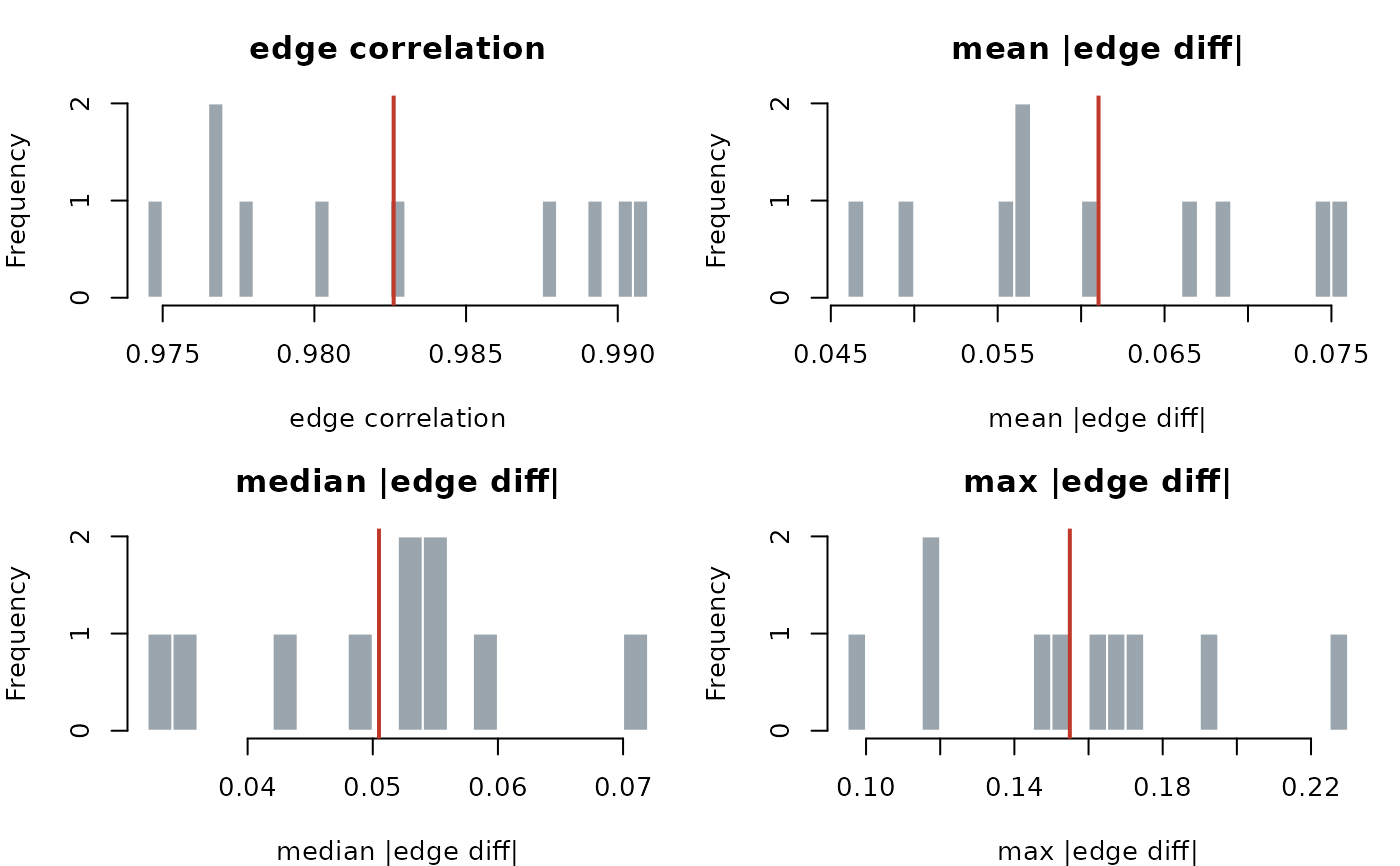
Histograms of the four between-halves edge metrics across split-half iterations, with each observed mean marked.
Usage
# S3 method for class 'psychnet_reliability'
plot(x, ...)Examples
# Fast example settings; see [net_split_reliability()] for the defaults a
# real assessment should use.
plot(net_split_reliability(SRL_Claude, method = "pcor", iter = 10))