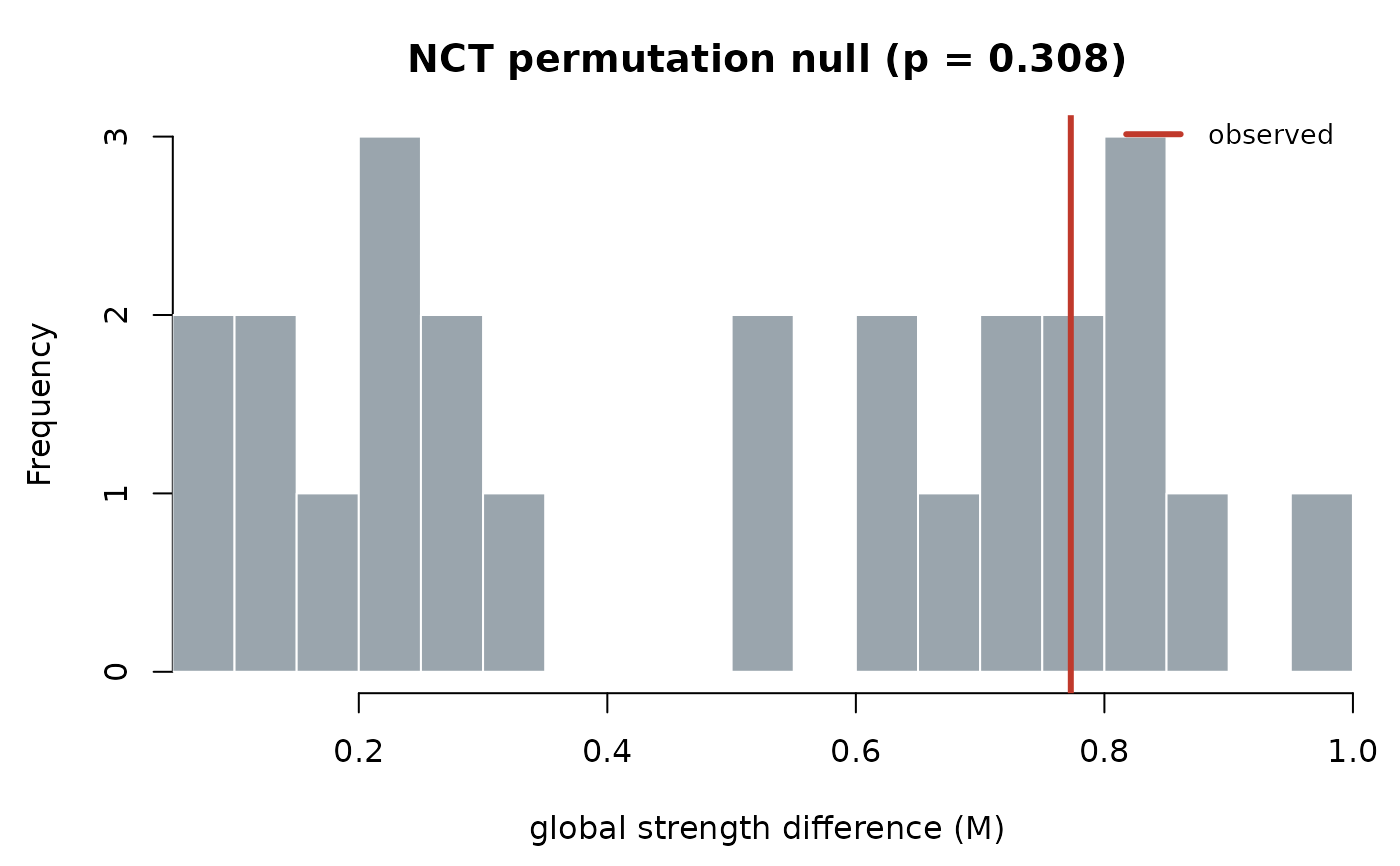
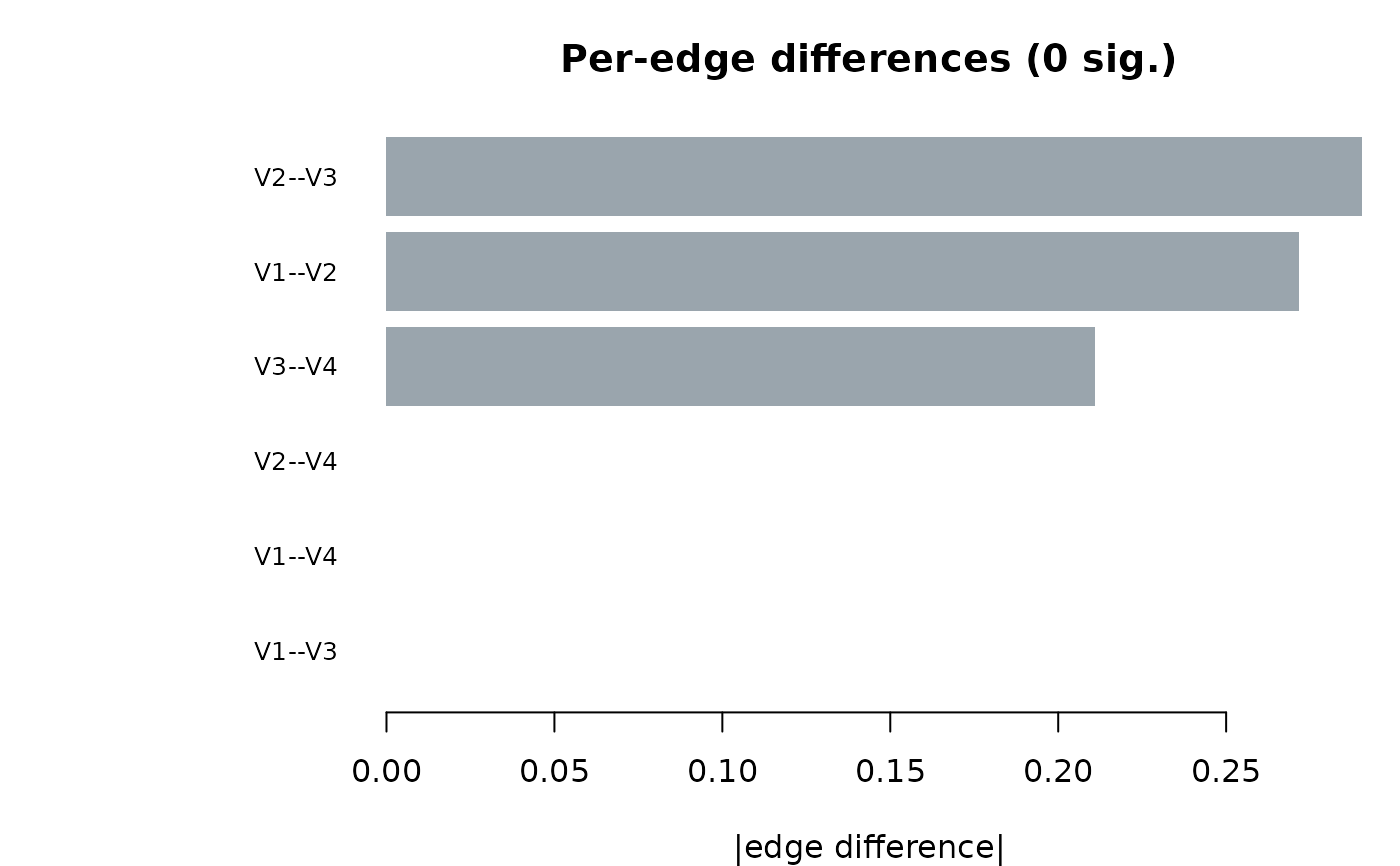
Visualises a net_compare() result. type = "strength" (default) and
type = "structure" draw the permutation null distribution for the global
strength invariance (M) and the maximum edge-difference (S) statistics, with
the observed value and p-value marked; type = "edges" draws the observed
per-edge absolute differences, coloured by whether each edge differs
significantly.
Arguments
- x
A
psychnet_nctobject fromnet_compare().- type
One of
"strength","structure","edges".- alpha
Significance level for colouring per-edge differences. Default
0.05.- ...
Unused.