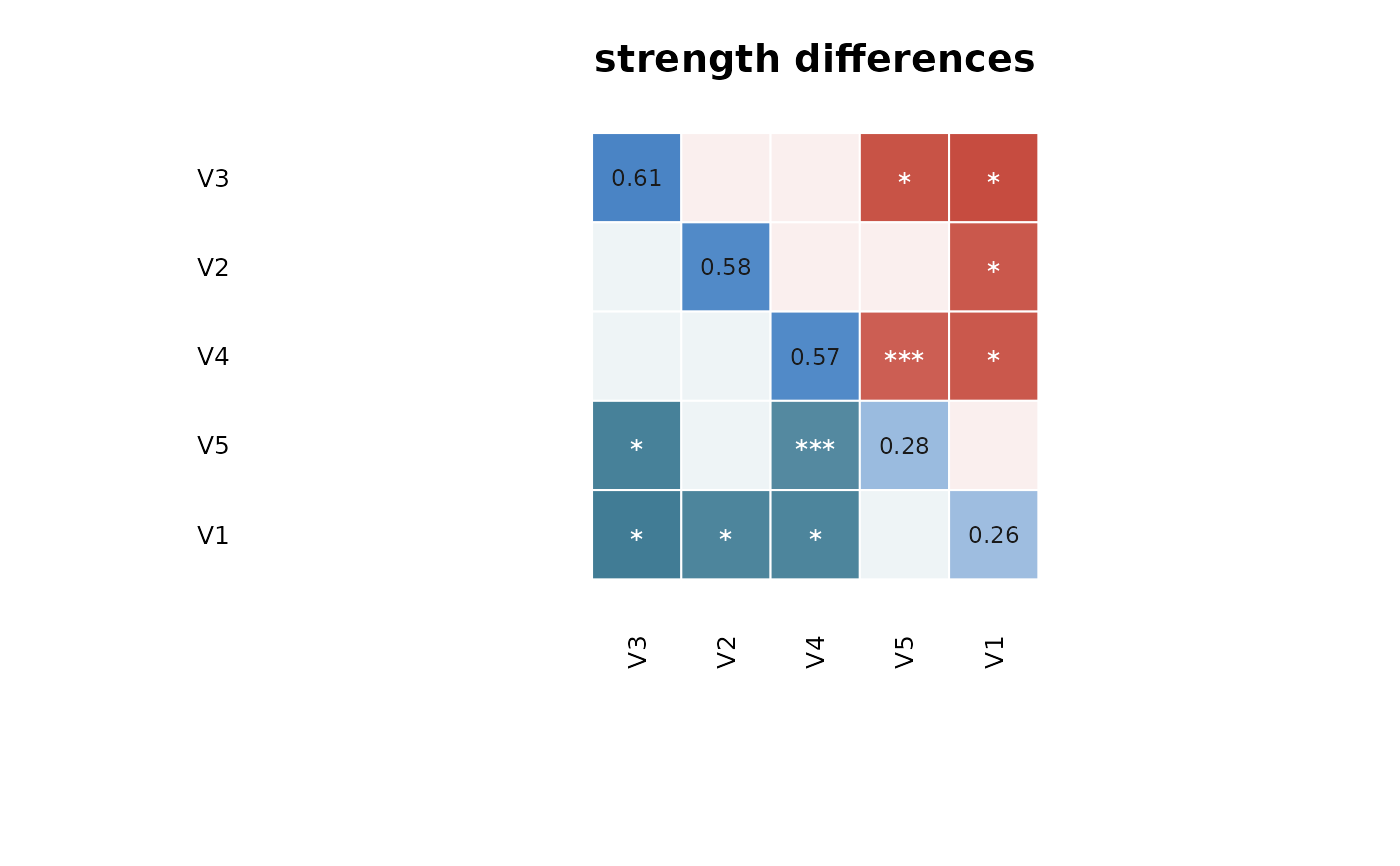
Draws the bootnet-style "significance box" matrix for the pairwise difference
test returned by difference_test(): items on both axes ordered by their
observed value, the diagonal showing the observed value, and each off-diagonal
cell filled when that pair differs significantly (red when the row item is
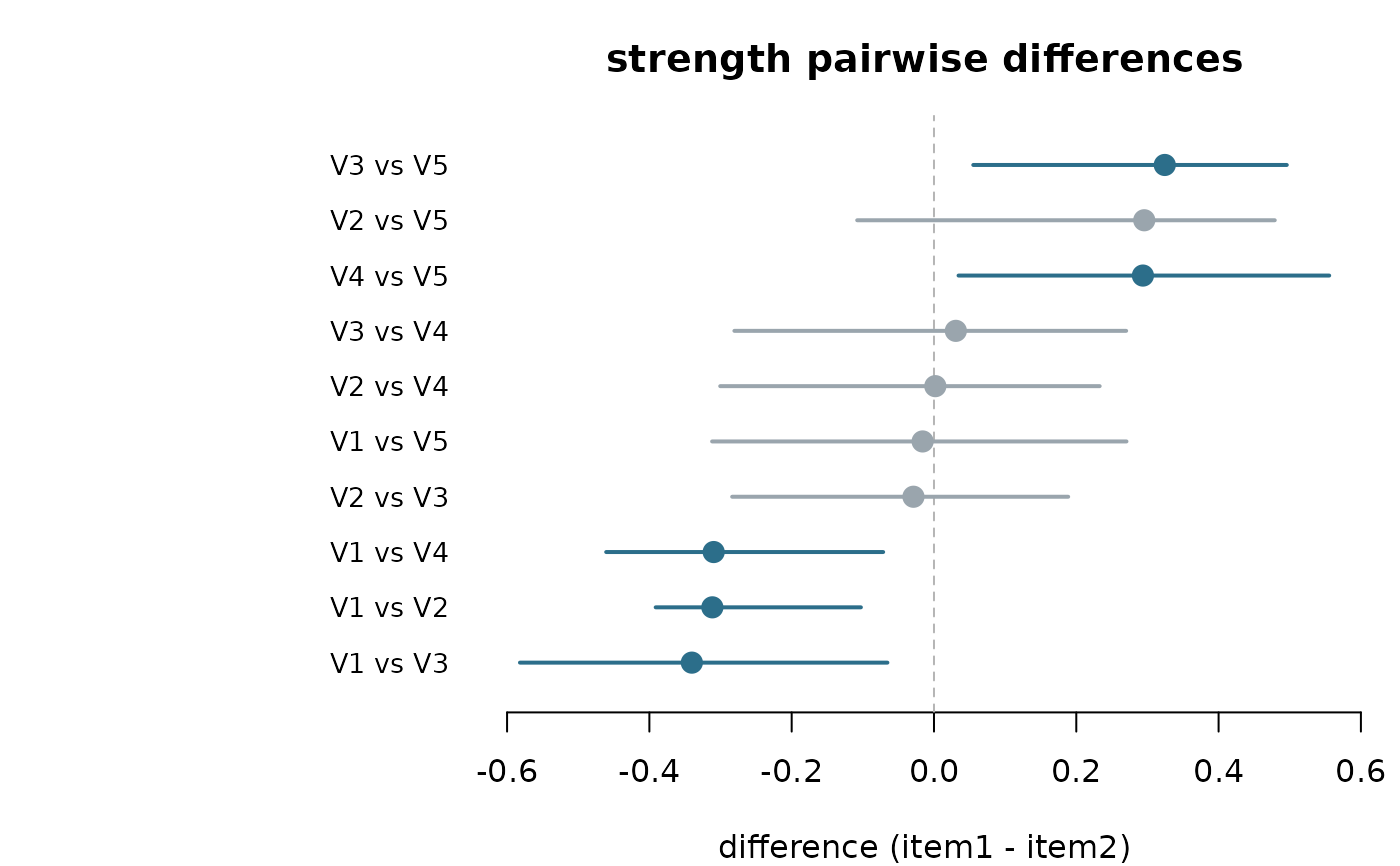
larger, blue when smaller). style = "forest" instead draws a forest plot:
one row per pair, the bootstrapped difference as a point with its confidence
interval, a reference line at zero, and significant pairs (interval excluding
zero) emphasised.
Arguments
- x
A
psychnet_differencedata frame fromdifference_test().- style
"box"(default) for the significance-box matrix, or"forest"for a forest plot of the pairwise differences with their CIs.- ...
Unused.
Examples
set.seed(1)
x <- matrix(stats::rnorm(150 * 5), 150, 5) %*% chol(0.4^abs(outer(1:5, 1:5, "-")))
colnames(x) <- paste0("V", 1:5)
# method = "pcor" keeps this example fast; the "glasso" default (and
# n_boot >= 1000) is what a real analysis should use.
bs <- net_boot(x, method = "pcor", n_boot = 50, cores = 1)
plot(difference_test(bs, type = "strength")) # box matrix
 plot(difference_test(bs, type = "strength"), style = "forest") # forest plot