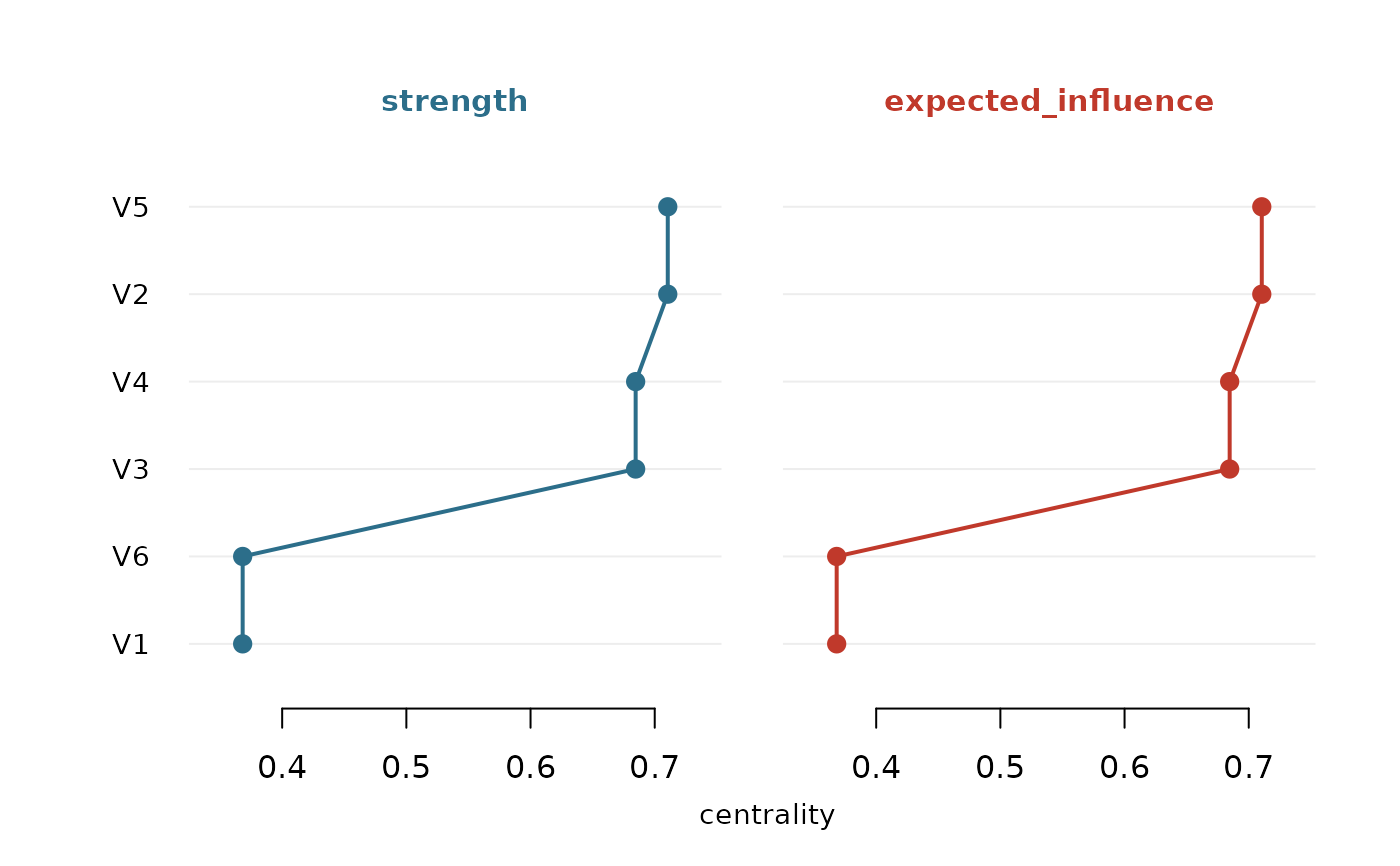
Draws the centrality table returned by net_centralities(). type = "bar"
gives one sorted horizontal lollipop panel per measure; type = "line" gives
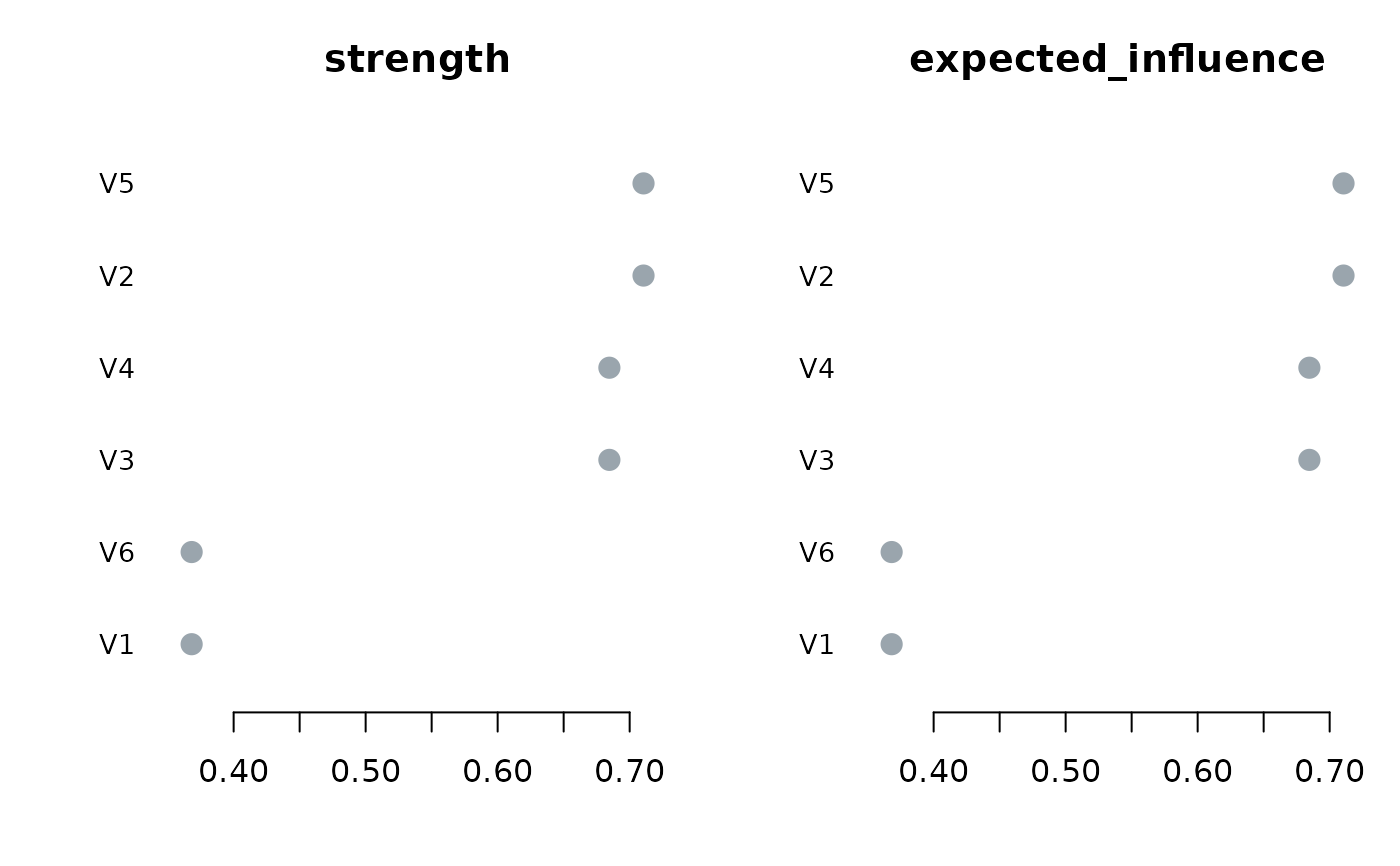
the qgraph/bootnet centrality plot — one faceted panel per measure, nodes on a
shared vertical axis, a line-and-marker series within each panel.
Arguments
- x
A
psychnet_centralitydata frame fromnet_centralities().- type
"bar"(default) for one sorted lollipop panel per measure, or"line"for the faceted qgraph-style centrality plot.- scale
For
type = "line", the per-measure transform:"raw"(default — each faceted panel keeps its own axis, so no rescaling is needed),"z"(z-score per measure, centred at 0), or"relative"(each measure min-max scaled to [0, 1]).type = "bar"always shows raw values.- measures
Which measure columns to draw. Default: all of them.
- ...
Unused.
Examples
S <- 0.4^abs(outer(1:6, 1:6, "-"))
fit <- ebic_glasso(cor_matrix = S, n = 300)
plot(net_centralities(fit))
 plot(net_centralities(fit), type = "line")