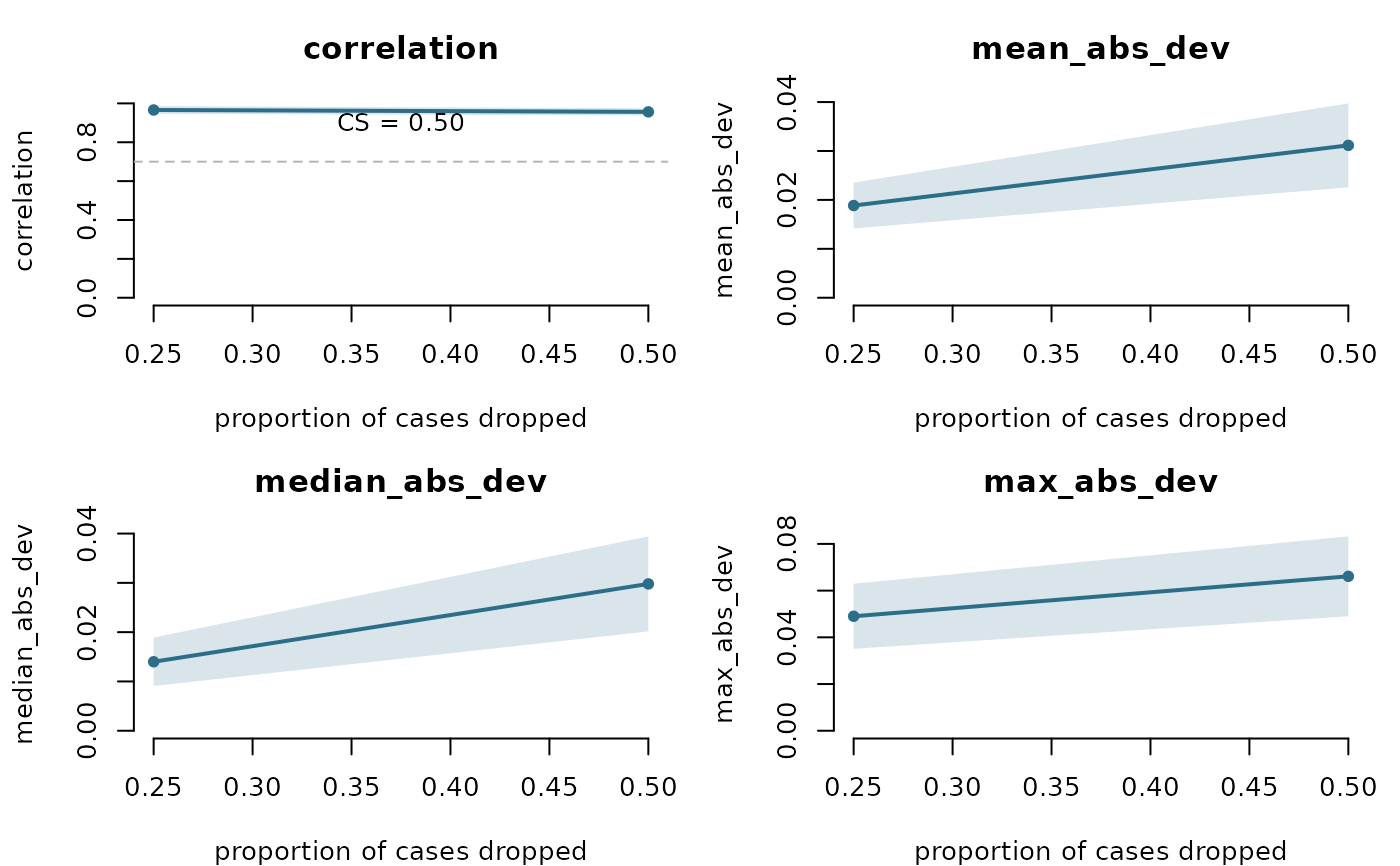
Draws the four similarity metrics (correlation, mean/median/max absolute deviation) against the proportion of cases dropped, each with a +/- 1 SD band; the correlation panel carries the acceptance threshold and CS-coefficient.
Usage
# S3 method for class 'psychnet_casedrop'
plot(x, ...)Examples
# Fast example settings; see [net_casedrop_reliability()] for the defaults
# a real assessment should use.
plot(net_casedrop_reliability(SRL_Claude, method = "pcor", iter = 5,
                              drop_prop = c(0.25, 0.5)))