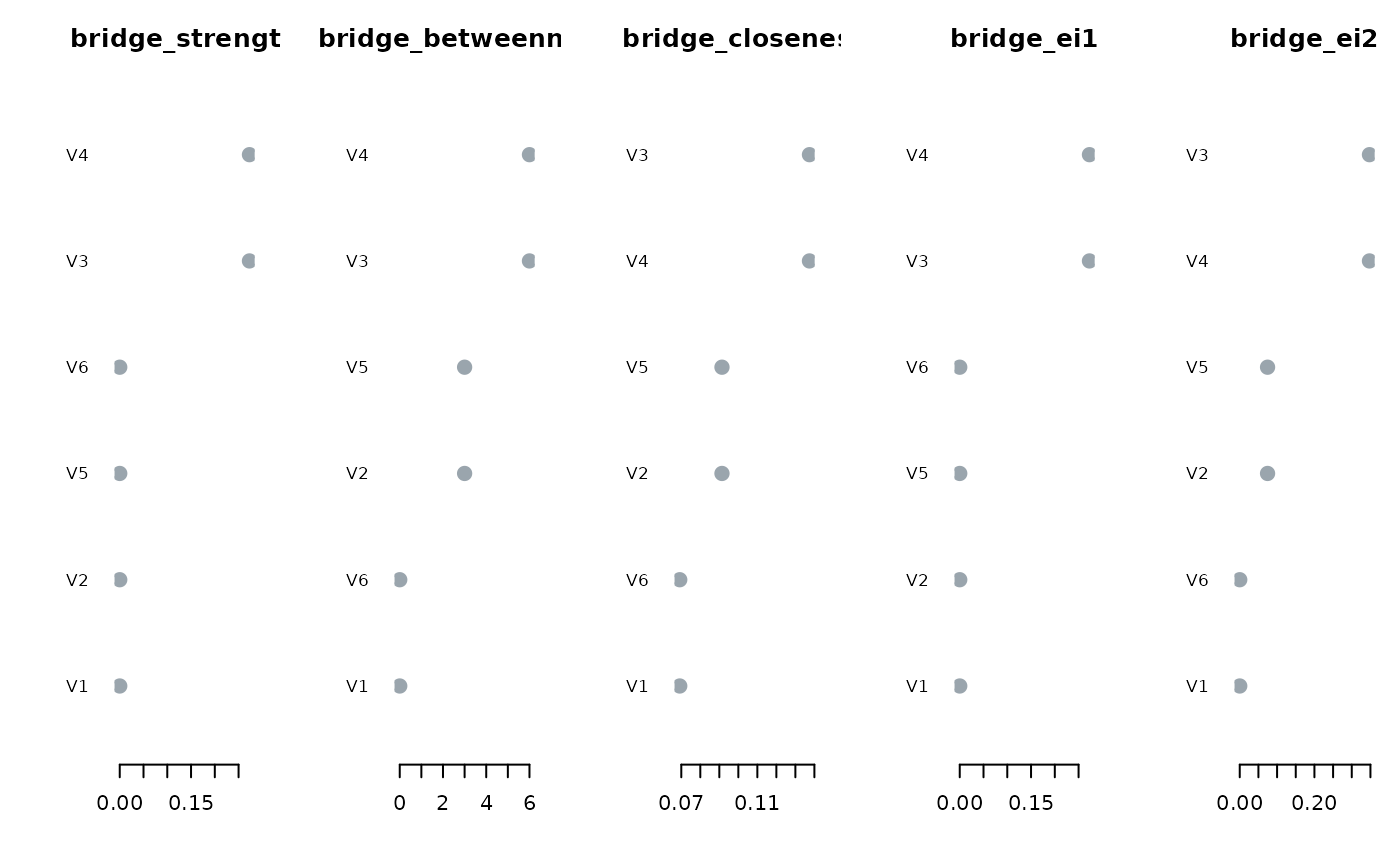
One sorted horizontal panel per bridge measure (nodes coloured by community).
Usage
# S3 method for class 'psychnet_bridge'
plot(x, measures = NULL, ...)
Arguments
- x
A
psychnet_bridgedata frame fromnet_bridge().- measures
Which bridge columns to draw. Default: all five.
- ...
Unused.
Examples
S <- 0.3^abs(outer(1:6, 1:6, "-"))
fit <- ebic_glasso(cor_matrix = S, n = 400)
plot(net_bridge(fit, communities = c(1, 1, 1, 2, 2, 2)))