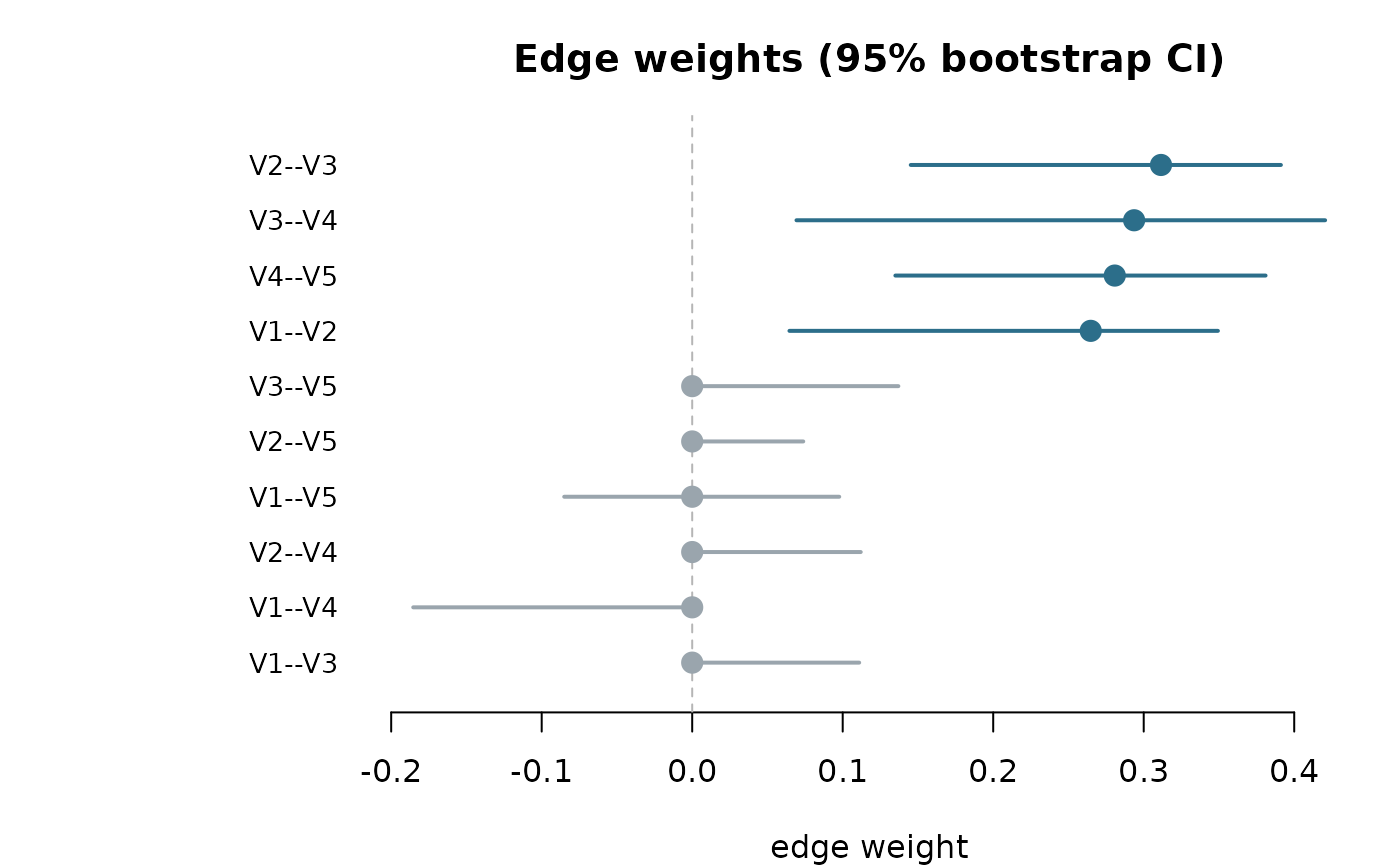
Visualises a net_boot() result. type = "edges" (default) draws the
bootstrapped edge-weight confidence intervals sorted by the observed weight
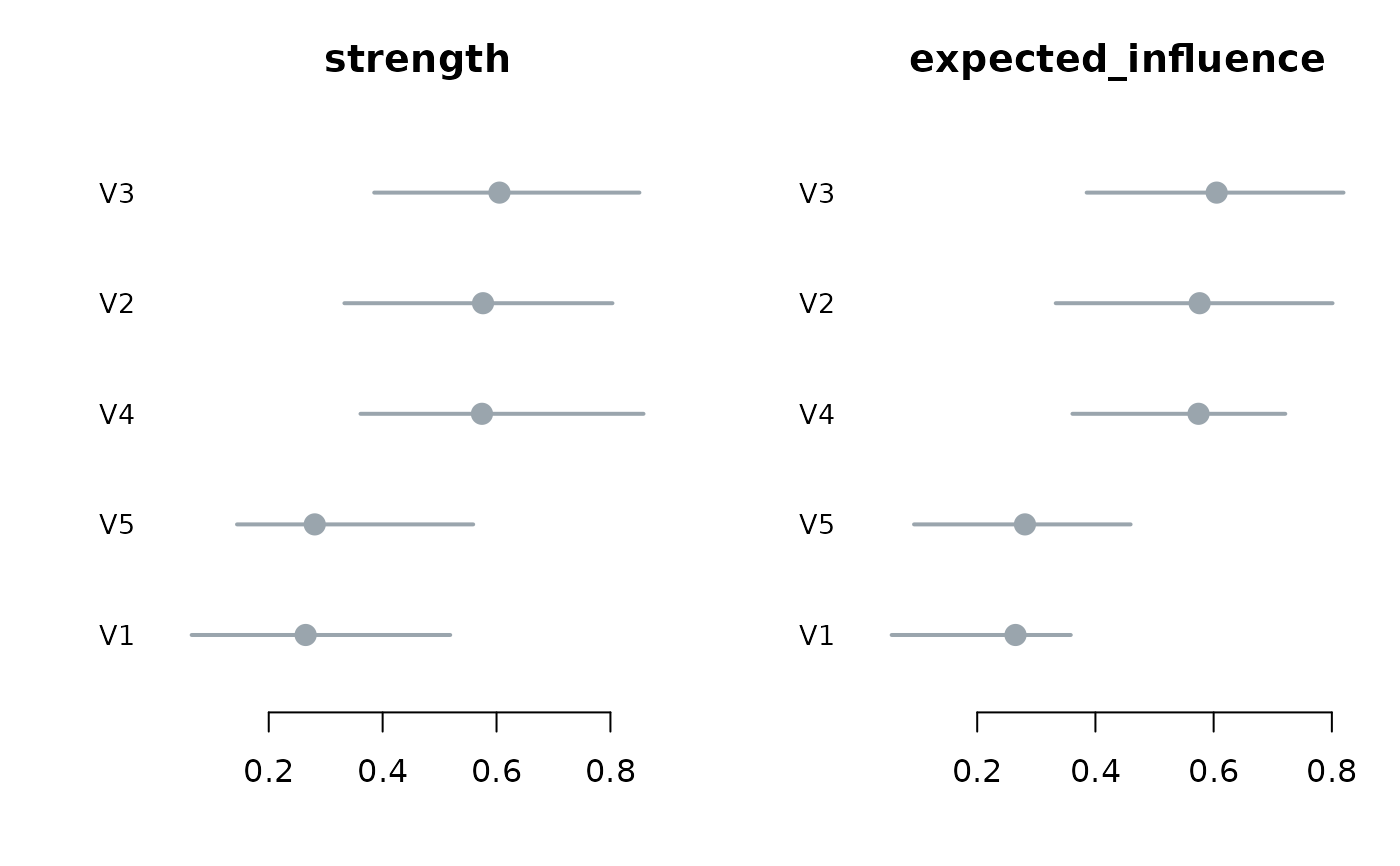
(bootnet's edge-accuracy plot); type = "centrality" draws the bootstrapped
centrality intervals, one sorted panel per measure; type = "edge_diff" and
type = "centrality_diff" draw the bootstrapped difference "significance box"
matrix for edges or for one centrality; type = "predictability" draws the
node predictability intervals (only when net_boot() was run with
predictability = TRUE).
Arguments
- x
A
psychnet_bootstrapobject fromnet_boot().- type
One of
"edges","centrality","edge_diff","centrality_diff","predictability".- measure
For
"centrality"/"centrality_diff", which measure(s) to draw. Default: all bootstrapped measures ("centrality") or the first ("centrality_diff").- ...
Unused.
Examples
set.seed(1)
x <- matrix(stats::rnorm(150 * 5), 150, 5) %*% chol(0.4^abs(outer(1:5, 1:5, "-")))
colnames(x) <- paste0("V", 1:5)
# method = "pcor" keeps this example fast; the "glasso" default (and
# n_boot >= 1000) is what a real analysis should use.
bs <- net_boot(x, method = "pcor", n_boot = 50, cores = 1)
plot(bs) # edge-weight CIs
 plot(bs, type = "centrality") # centrality CIs