Case study: regulation in high and low achieving groups
Written by Mohammed Saqr and Sonsoles López-Pernas
Source:vignettes/articles/case-group-regulation.Rmd
case-group-regulation.RmdStudents who learn together have to regulate their joint work: they plan, monitor progress, build consensus, discuss, manage the emotional climate and adapt when something fails. Socially shared regulation is a sequence of such acts, and its quality lies less in how often each act occurs than in what follows what. Planning that leads to monitoring is a different process from planning that leads to more planning. A comparison of high and low achieving students therefore asks whether the two groups order their regulation differently, not only whether they use different acts.
Lag sequential analysis gives the per-transition answer. Within each
group, it tests every ordered pair of acts against the frequency
expected if the next act did not depend on the current one (Bakeman
& Quera, 2011). Between groups, compare_lsa() asks
whether a transition’s departure from independence differs more than a
random relabelling of the students would produce, and
bayes_compare_lsa() estimates how large the difference in
transition probability is. This case study sets up the sequences,
describes the regulation transitions of each achievement group, locates
the transitions where the groups differ and checks those differences
with a Bayesian comparison.
Data
group_regulation_long is a long event log of coded
regulation acts in collaborative learning, the long companion of the
group_regulation sequence data, taken from the tna package.
Each row is one act.
-
Student:
Actor— 2,000 students; each student’s acts form one sequence. -
Achievement group:
Achiever—HighorLow, the grouping variable of the comparison. -
Collaboration group:
Group— 200 groups of students who work together. -
Course:
Course—A,BorC. -
Time stamp:
Time— date and clock time of the act; orders the acts within a student. -
Act:
Action— one of nine regulation acts:adapt,cohesion,consensus,coregulate,discuss,emotion,monitor,plan,synthesis.
head(group_regulation_long)
#>   Actor Achiever Group Course                Time    Action
#> 1     1     High     1      A 2025-01-01 08:27:07  cohesion
#> 2     1     High     1      A 2025-01-01 08:35:20 consensus
#> 3     1     High     1      A 2025-01-01 08:42:18   discuss
#> 4     1     High     1      A 2025-01-01 08:50:00 synthesis
#> 5     1     High     1      A 2025-01-01 08:52:25     adapt
#> 6     1     High     1      A 2025-01-01 08:57:31 consensus
with(group_regulation_long, table(Action))
#> Action
#>      adapt   cohesion  consensus coregulate    discuss    emotion    monitor       plan
#>        554       1839       6797       2133       4267       3075       1516       6623
#>  synthesis
#>        729
with(group_regulation_long, table(Course, Achiever))
#>       Achiever
#> Course  High   Low
#>      A 12390     0
#>      B  1331  8295
#>      C     0  5517
The 27,533 acts are dominated by consensus (6,797) and
plan (6,623); adapt (554) and
synthesis (729) are the rarest. The course table carries an
important constraint for interpretation: course A holds
only high achievers and course C only low achievers, and
only course B holds both. Achievement and course are
therefore largely confounded, and every difference between the groups
below is also, in part, a difference between courses.
aggregate(cbind(students = Actor, achievement_levels = Achiever) ~ Group,
          data = group_regulation_long,
          FUN = \(x) length(unique(x))) |>
  summary()
#>      Group          students  achievement_levels
#>  Min.   :  1.0   Min.   :10   Min.   :1
#>  1st Qu.: 50.8   1st Qu.:10   1st Qu.:1
#>  Median :100.5   Median :10   Median :1
#>  Mean   :100.5   Mean   :10   Mean   :1
#>  3rd Qu.:150.2   3rd Qu.:10   3rd Qu.:1
#>  Max.   :200.0   Max.   :10   Max.   :1
Every collaboration group has 10 students, all with the same achievement level. Students are nested in collaboration groups, and the 1,000 students in each achievement group come from 100 collaboration groups.
How are the sequences built?
In a long log, a sequence is defined by the columns that bound it.
With actor = "Actor", each student’s acts form a sequence,
ordered by Time. When a time column is given,
lsa() also starts a new sequence whenever two consecutive
acts of a student are more than time_threshold seconds
apart (900 seconds, 15 minutes, by default). The largest gap between
consecutive acts of each student shows whether that rule splits anything
here.
aggregate(cbind(largest_gap_s = as.numeric(Time)) ~ Actor,
          data = group_regulation_long,
          FUN = \(x) max(diff(sort(x)))) |>
  summary()
#>      Actor      largest_gap_s
#>  Min.   :   1   Min.   : 13
#>  1st Qu.: 501   1st Qu.:432
#>  Median :1000   Median :471
#>  Mean   :1000   Mean   :441
#>  3rd Qu.:1500   3rd Qu.:488
#>  Max.   :2000   Max.   :500
No student has a gap longer than 500 seconds, so the default threshold keeps each student’s acts in one sequence. A shorter threshold would cut through the ordinary pace of the work.
lsa(group_regulation_long, actor = "Actor", action = "Action",
    time = "Time") |>
  summary() |>
  as.data.frame()
#>      engine lag n_states n_sequences n_events n_transitions n_significant alpha  lrx2
#> 1 classical   1        9        2000    27533         25533            72  0.05 13204
#>   lrx2_df lrx2_p    x2 x2_df x2_p
#> 1      64      0 15435    64    0
lsa(group_regulation_long, actor = "Actor", action = "Action",
    time = "Time", time_threshold = 300) |>
  summary() |>
  as.data.frame()
#>      engine lag n_states n_sequences n_events n_transitions n_significant alpha lrx2
#> 1 classical   1        9       12305    27533         15228            69  0.05 7927
#>   lrx2_df lrx2_p   x2 x2_df x2_p
#> 1      64      0 9222    64    0
With the default threshold the log yields 2,000 sequences, one per student, and 25,533 transitions. A 300-second threshold splits the same log into 12,305 sequences and keeps only 15,228 transitions, because every transition across a gap is dropped. Gaps of up to about eight minutes between the acts of a student working in a group are part of one session, not a break between sessions, so the analysis keeps the default.
Which transitions characterise each group?
group = "Achiever" fits one model per achievement group.
Both fits share the same nine states, so their tables are directly
comparable.
g <- lsa(group_regulation_long, actor = "Actor", action = "Action",
         time = "Time", group = "Achiever")
summary(g)
#>   group    engine lag n_states n_sequences n_events n_transitions n_significant alpha
#> 1  High classical   1        9        1000    13721         12721            66  0.05
#> 2   Low classical   1        9        1000    13812         12812            67  0.05
#>   lrx2 lrx2_df lrx2_p   x2 x2_df x2_p
#> 1 6147      64      0 6807    64    0
#> 2 7715      64      0 9197    64    0
Each group contributes 1,000 sequences; the high achievers have 12,721 transitions and the low achievers 12,812. In both groups the independence model fails (G² = 6,147 and 7,715 on 64 degrees of freedom), and 66 and 67 of the 81 transitions are significant. With more than 12,000 transitions per group almost every cell is significant, so the comparison of the groups rests on the size of the effects rather than on the significance flags. The frequent over-represented transitions, those observed at least 400 times, are the backbone of each group’s regulation.
transitions(g, direction = "over", min_count = 400, sort = "strength")
#>    group      from         to lag count expected  prob prob_col adj_res         p yules_q
#> 1   High   emotion   cohesion   1   505    114.0 0.326    0.540   40.59  0.00e+00  0.8467
#> 2   High consensus coregulate   1   580    254.4 0.171    0.608   24.79 1.21e-135  0.6632
#> 3   High consensus       plan   1  1236    777.0 0.364    0.424   21.90 2.64e-106  0.4466
#> 4   High  cohesion  consensus   1   503    253.6 0.536    0.146   19.05  6.28e-81  0.5540
#> 5   High   discuss  consensus   1   851    541.5 0.425    0.247   16.96  1.53e-64  0.3977
#> 6   High      plan       plan   1   948    662.5 0.328    0.325   14.37  7.58e-47  0.3221
#> 7   High consensus    discuss   1   789    529.6 0.233    0.397   14.33  1.39e-46  0.3462
#> 8   High      plan    emotion   1   527    344.9 0.182    0.347   11.89  1.36e-32  0.3310
#> 9   High   emotion  consensus   1   521    419.0 0.336    0.151    6.22  4.87e-10  0.1776
#> 10  High      plan  consensus   1   850    781.8 0.294    0.247    3.25  1.17e-03  0.0758
#> 11   Low   emotion   cohesion   1   418     78.6 0.325    0.535   41.67  0.00e+00  0.8730
#> 12   Low consensus coregulate   1   608    261.6 0.207    0.533   25.56 3.80e-144  0.6413
#> 13   Low consensus       plan   1  1269    756.5 0.432    0.385   24.63 5.60e-134  0.4922
#> 14   Low      plan       plan   1  1356    841.0 0.415    0.411   23.88 5.24e-126  0.4706
#> 15   Low   discuss    discuss   1   431    293.4 0.221    0.223    9.46  3.03e-21  0.2793
#> 16   Low      plan  consensus   1   938    746.7 0.287    0.320    9.24  2.57e-20  0.2091
#>     kappa kappa_z   kappa_p lift sign significant
#> 1  0.4255   37.69 6.36e-311 4.43 over        TRUE
#> 2  0.4615   24.61 9.79e-134 2.28 over        TRUE
#> 3  0.1804   18.96  3.49e-80 1.59 over        TRUE
#> 4  0.3107   17.11  1.27e-65 1.98 over        TRUE
#> 5  0.1728   14.55  5.70e-48 1.57 over        TRUE
#> 6  0.1028   12.04  2.27e-33 1.43 over        TRUE
#> 7  0.1338   11.27  1.92e-29 1.49 over        TRUE
#> 8  0.1118    9.07  1.24e-19 1.53 over        TRUE
#> 9  0.0585    4.26  2.06e-05 1.24 over        TRUE
#> 10 0.0108    1.14  2.56e-01 1.09 over        TRUE
#> 11 0.4543   40.13  0.00e+00 5.32 over        TRUE
#> 12 0.3757   24.78 1.58e-135 2.32 over        TRUE
#> 13 0.1992   21.74 8.64e-105 1.68 over        TRUE
#> 14 0.1747   20.54  1.04e-93 1.61 over        TRUE
#> 15 0.0625    7.35  1.99e-13 1.47 over        TRUE
#> 16 0.0580    6.33  2.43e-10 1.26 over        TRUE
Both groups share a common core. emotion to
cohesion is the strongest transition in both (z = 40.6 for
high and 41.7 for low achievers, lift 4.43 and 5.32): an emotional
expression is followed by an act of group cohesion.
consensus leads to coregulate and to
plan in both groups, and plan persists in
both. The groups differ in what surrounds this core. Among the high
achievers, cohesion leads on to consensus (z =
19.1), discuss leads to consensus (z = 17.0),
consensus returns to discuss (z = 14.3) and
plan leads to emotion (z = 11.9); none of
these reaches 400 observations with a positive residual among the low
achievers. The low achievers’ backbone has one transition the high
achievers’ lacks, discuss persisting (z = 9.5), and a
stronger persistence of plan (1,356 transitions, z = 23.9,
against 948 and z = 14.4). The high achievers’ regulation moves between
discussion, consensus and cohesion; the low achievers’ stays longer
within planning and within discussion.
Where do the groups differ?
compare_lsa() tests the groups transition by transition.
Its default measure is the log odds ratio of each transition, a measure
of the departure from independence that does not grow with the number of
transitions. The test permutes the achievement label of whole students,
R = 1,000 times, and compares each observed difference with its
permutation distribution. Transitions with fewer than 5 pooled
observations are not tested, and the p-values are adjusted for the
number of transitions tested with the Benjamini-Hochberg false discovery
rate procedure (adjust = "BH").
set.seed(2026)
cmp <- compare_lsa(g, R = 1000, adjust = "BH")
cmp
#> <lsa_comparison>
#>   groups:   High vs Low
#>   measure:  log_or difference (High - Low)
#>   R:        1000 label permutations
#>   edges:    39 significant of 78 tested (adjust = BH)
#>   omnibus:  statistic = 79.48, p = 0.000999
as.data.frame(cmp, what = "global")
#>   group_a group_b statistic  p_value    R
#> 1    High     Low      79.5 0.000999 1000
The omnibus test, the sum of squared differences across all transitions, gives p = 0.001, the smallest value 1,000 permutations can produce: the two transition structures differ. 78 of the 81 transitions are tested and 39 of them differ after the adjustment. The strongest differences:
transitions(cmp, significant = TRUE, sort = "strength") |> head(12)
#>          from         to log_or_a log_or_b  diff   p_perm   p_adj significant
#> 1    cohesion      adapt   -0.794   -3.921  3.13 0.000999 0.00354        TRUE
#> 2     emotion  synthesis   -1.619   -4.522  2.90 0.000999 0.00354        TRUE
#> 3        plan  synthesis   -2.145   -4.951  2.81 0.001998 0.00577        TRUE
#> 4    cohesion  synthesis   -1.355   -3.945  2.59 0.005994 0.01461        TRUE
#> 5   synthesis    monitor   -3.229   -0.975 -2.25 0.008991 0.02063        TRUE
#> 6   synthesis       plan   -0.581   -2.680  2.10 0.000999 0.00354        TRUE
#> 7       adapt coregulate   -3.146   -1.176 -1.97 0.013986 0.02871        TRUE
#> 8        plan      adapt   -2.338   -4.230  1.89 0.024975 0.04995        TRUE
#> 9  coregulate      adapt    0.778   -1.077  1.85 0.000999 0.00354        TRUE
#> 10   cohesion   cohesion   -0.587   -2.338  1.75 0.000999 0.00354        TRUE
#> 11  synthesis coregulate   -1.734   -0.319 -1.41 0.002997 0.00806        TRUE
#> 12    discuss      adapt    1.010    2.251 -1.24 0.000999 0.00354        TRUE
diff is the log odds ratio of the high achievers minus
that of the low achievers. The largest differences involve the rare acts
synthesis and adapt, which is where low
achievers avoid transitions much more strongly. cohesion to
adapt has a log odds ratio of -0.79 among high achievers
and -3.92 among low achievers (difference 3.13); emotion to
synthesis and plan to synthesis
are avoided by both groups but far more by the low achievers
(differences 2.90 and 2.81). In the other direction, low achievers move
from discuss to adapt more than high achievers
do (difference -1.24), and they avoid the moves from
synthesis to monitor and to
coregulate far less (log odds ratios -0.97 and -0.32,
against -3.23 and -1.73). The picture is that high achievers reach
synthesis from more points of the process, while low achievers adapt and
monitor after discussion and synthesis.
The largest differences sit in rare transitions. The frequent transitions, which carry most of the regulation, are better seen in a back-to-back barrel plot of the twelve most frequent transitions.
plot(cmp, top_n = 12)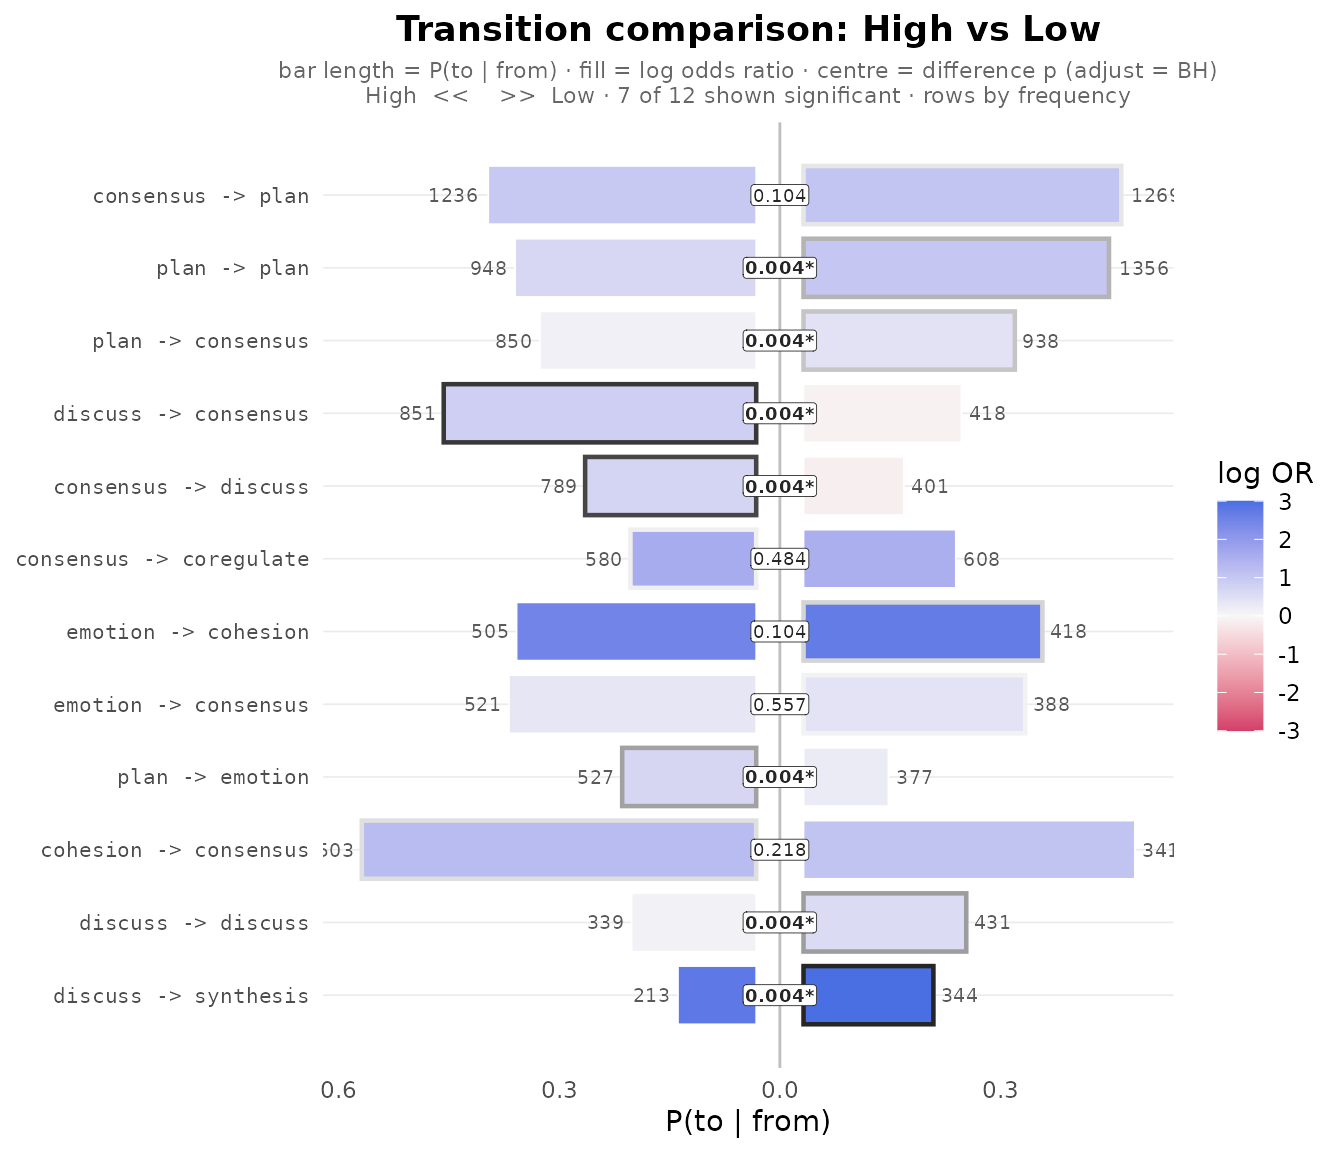
Each row is one transition; the high achievers’ bar runs to the left
and the low achievers’ to the right. Bar length is the transition
probability, bar colour the group’s log odds ratio (blue above
independence, red below), the number at the end of each bar the observed
count, and the central chip the BH-adjusted p-value of the difference,
starred when significant. A dark border marks the group with the higher
value when the difference is large. Seven of the twelve frequent
transitions differ. discuss to consensus and
consensus to discuss have long blue bars on
the high achievers’ side and short, near-white bars on the low
achievers’ side: discussion and consensus alternate among high achievers
and not among low achievers. On the low achievers’ side,
plan to plan, discuss to
discuss and discuss to synthesis
are the longer bars. emotion to cohesion, the
strongest transition in both groups, does not differ.
A Bayesian check
The permutation test compares log odds ratios.
bayes_compare_lsa() compares the transition probabilities
themselves. It places a Dirichlet posterior on each row of each group’s
table, draws from the posterior of the difference in each transition
probability and reports its 95% credible interval. A transition is
flagged as credibly different when the interval excludes zero, the
difference exceeds 0.01 and the interval bound nearest zero exceeds
0.001. The p_adj column holds the Bayesian two-sided
p-values, also Benjamini-Hochberg adjusted (adjust = "BH");
the flag itself is set by the credible interval.
bc <- bayes_compare_lsa(g, adjust = "BH", seed = 2026)
as.data.frame(bc, what = "global")
#>   group_a group_b n_credible
#> 1    High     Low         38
transitions(bc, significant = TRUE, sort = "strength") |> head(10)
#>          from         to prob_a prob_b    diff  ci_low ci_high pd effect_size p_value
#> 1     discuss  consensus 0.4242 0.2143  0.2098  0.1808  0.2381  1       14.46   0e+00
#> 2   synthesis  consensus 0.5681 0.3818  0.1864  0.1097  0.2606  1        4.79   0e+00
#> 3   synthesis      adapt 0.1434 0.2999 -0.1565 -0.2168 -0.0937  1       -5.01   0e+00
#> 4   synthesis       plan 0.1434 0.0251  0.1183  0.0766  0.1650  1        5.27   0e+00
#> 5   consensus    discuss 0.2324 0.1365  0.0960  0.0767  0.1147  1        9.89   0e+00
#> 6     discuss      adapt 0.0242 0.1201 -0.0959 -0.1120 -0.0803  1      -11.92   0e+00
#> 7        plan       plan 0.3275 0.4149 -0.0874 -0.1114 -0.0632  1       -7.09   0e+00
#> 8    cohesion  consensus 0.5342 0.4485  0.0858  0.0373  0.1341  1        3.48   6e-04
#> 9    cohesion coregulate 0.0812 0.1661 -0.0850 -0.1169 -0.0543  1       -5.24   0e+00
#> 10 coregulate    discuss 0.2343 0.3050 -0.0707 -0.1089 -0.0314  1       -3.58   4e-04
#>      p_adj significant
#> 1  0.00000        TRUE
#> 2  0.00000        TRUE
#> 3  0.00000        TRUE
#> 4  0.00000        TRUE
#> 5  0.00000        TRUE
#> 6  0.00000        TRUE
#> 7  0.00000        TRUE
#> 8  0.00202        TRUE
#> 9  0.00000        TRUE
#> 10 0.00141        TRUE
38 of the 81 transition probabilities differ credibly. The largest
difference is discuss to consensus: 42.4% of
the high achievers’ discussion acts are followed by consensus, against
21.4% of the low achievers’, a difference of 0.210 with a 95% credible
interval of 0.181 to 0.238. High achievers also move from
synthesis to consensus more often (difference
0.186) and from synthesis to plan (0.118),
while low achievers move from synthesis to
adapt (difference -0.16) and from discuss to
adapt (-0.096) more often.
The two comparisons answer different questions and agree where they
overlap. discuss to adapt and
synthesis to plan differ on both scales, in
the same direction. discuss to consensus has
the largest probability difference and a significant log odds ratio
difference that is not among the twelve largest, because the log odds
ratio discounts the high base rate of consensus.
Transitions among rare acts, such as cohesion to
adapt, have the largest log odds ratio differences but
probability differences too small to be flagged by the Bayesian
comparison. Both tests treat each student as independent, and the next
section returns to that assumption.
What the analysis shows
- The log yields one sequence per student; no student pauses for more than 500 seconds, so the 15-minute session threshold splits nothing.
- High and low achievers share a regulation core:
emotiontocohesion,consensustocoregulateand toplan, and persistent planning. - The transition structures differ (omnibus permutation p = 0.001), with 39 of 78 tested transitions differing after Benjamini-Hochberg adjustment and 38 of 81 transition probabilities differing credibly.
- High achievers alternate between discussion and consensus and move from synthesis to consensus and planning; low achievers move from discussion and synthesis to adaptation and stay longer in planning and discussion.
- The largest differences in log odds ratio involve the rare acts
synthesisandadapt; the largest differences in probability involve the frequent move fromdiscusstoconsensus.
The design limits what these differences mean. Achievement is
confounded with course: courses A and C each
hold a single achievement level, so a course effect cannot be separated
from an achievement effect in these data. A comparison restricted to
course B would separate them. Students are also nested in
collaboration groups of 10 that share their interaction, while both
comparisons treat the 2,000 students as independent units. Within-group
dependence makes the p-values and credible intervals narrower than they
should be, so the differences near the significance threshold deserve
less weight than the large ones. Finally, the models are first order and
pool all acts of a student: they describe what follows what, not how the
process changes over a session. For the comparison methods themselves,
see the group comparison article;
for building sequences from logs, see the
event logs guide.