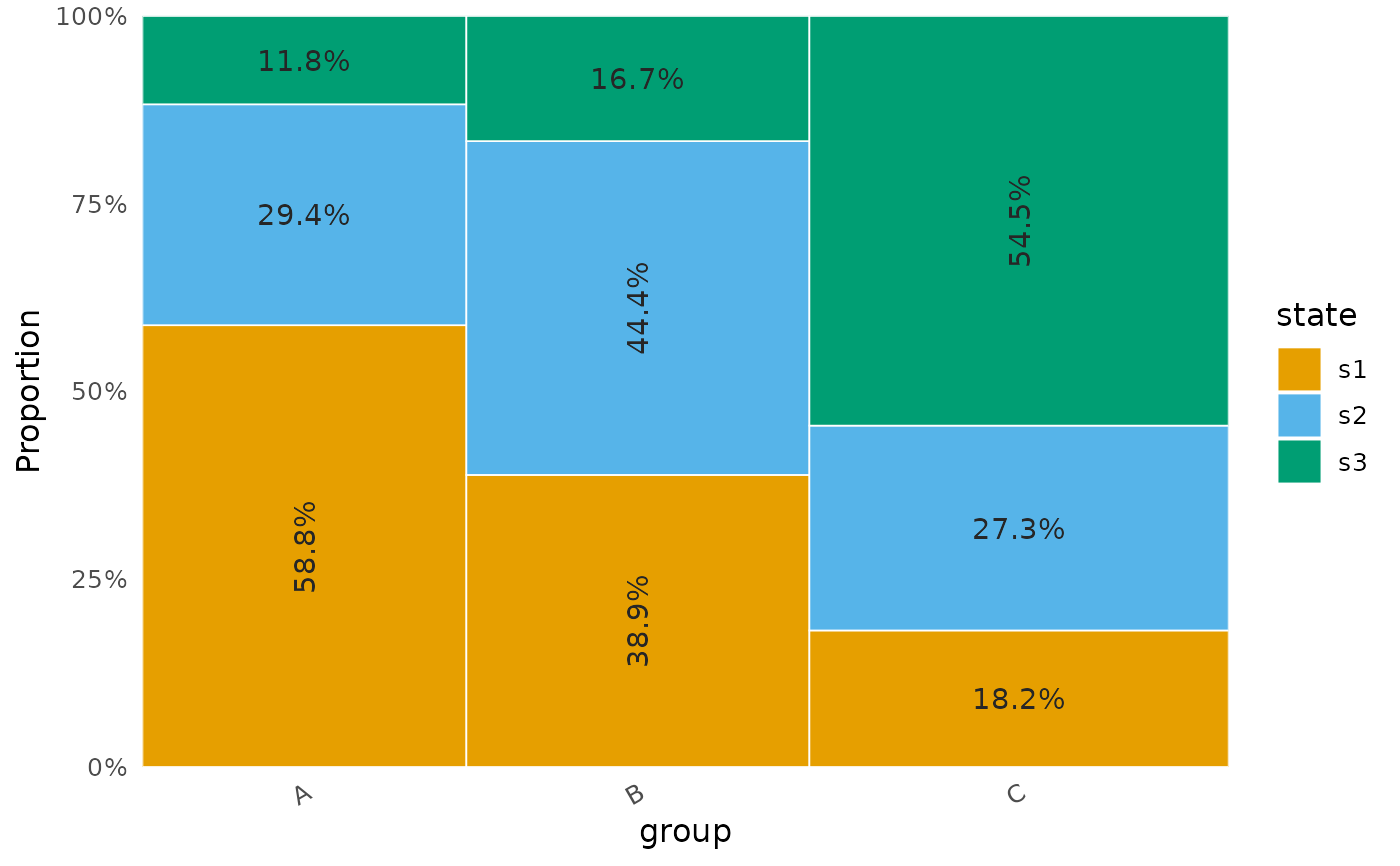
Draw a Marimekko / Mosaic Plot from a Tidy Data Frame
Source:R/plot_state_frequencies.R
plot_mosaic.RdLow-level rectangle-coordinate builder for marimekko (mosaic) plots.
Column widths are proportional to the per-column total of weight;
within each column, segments stack to height 1 with sub-heights
proportional to each row's share of that column's total.
Usage
plot_mosaic(
  data,
  x,
  y,
  weight,
  fill = "y",
  colors = NULL,
  show_labels = TRUE,
  label_size = 3.5,
  x_label = NULL,
  y_label = NULL
)
Arguments
- data
A data.frame in long form. Must contain the columns named in
x,y, andweight.- x
Column name for the X (column) variable.
- y
Column name for the Y (segment) variable.
- weight
Column name for the cell weight (e.g. count).
- fill
Either
"y"(color by Y category, e.g. state – default) or the name of another column to map to fill (e.g. a residual column for diverging color).- colors
Optional fill colors. Either an unnamed vector applied in level order (when
fill = "y", length must be at least the number of distinct y levels), or a named lookup (c(plan = "#0072B2")) overriding only the levels you name. Defaults to recycled Okabe-Ito.- show_labels
If
TRUE, draw within-segment percentage labels.- label_size
Numeric size for segment labels.
- x_label, y_label
Optional axis labels.
Details
Used internally by plot_state_frequencies; exposed so that
other plot methods (e.g. permutation-residual visualisations) can reuse
the same geometry by supplying a different fill column.