
Computes per-state stability metrics from a transition network: persistence (self-loop probability), stationary distribution, mean recurrence time, sojourn time, and mean accessibility to/from other states.
Usage
markov_stability(x, normalize = TRUE)

# S3 method for class 'net_markov_stability'
print(x, ...)

# S3 method for class 'net_markov_stability_group'
print(x, ...)

# S3 method for class 'net_markov_stability'
summary(object, ...)

# S3 method for class 'net_markov_stability'
plot(
  x,
  metrics = c("persistence", "stationary_prob", "return_time", "sojourn_time",
    "avg_time_to_others", "avg_time_from_others"),
  combined = TRUE,
  ...
)
Arguments
- x
A
netobject,cograph_network,tnaobject, row-stochastic numeric transition matrix, or a wide sequence data.frame (rows = actors, columns = time-steps). For theprint()andplot()methods: an object of classnet_markov_stabilityornet_markov_stability_group.- normalize
Logical. Normalize rows to sum to 1? Default
TRUE.- ...
Ignored. In
plot.net_markov_stability(),print.net_markov_stability()andsummary.net_markov_stability(): Ignored. Inprint.net_markov_stability_group(): Forwarded toprint.net_markov_stabilityfor each element.- object
For the
summary()method: an object of classnet_markov_stability.- metrics
Character vector. Which metrics to plot. Options:
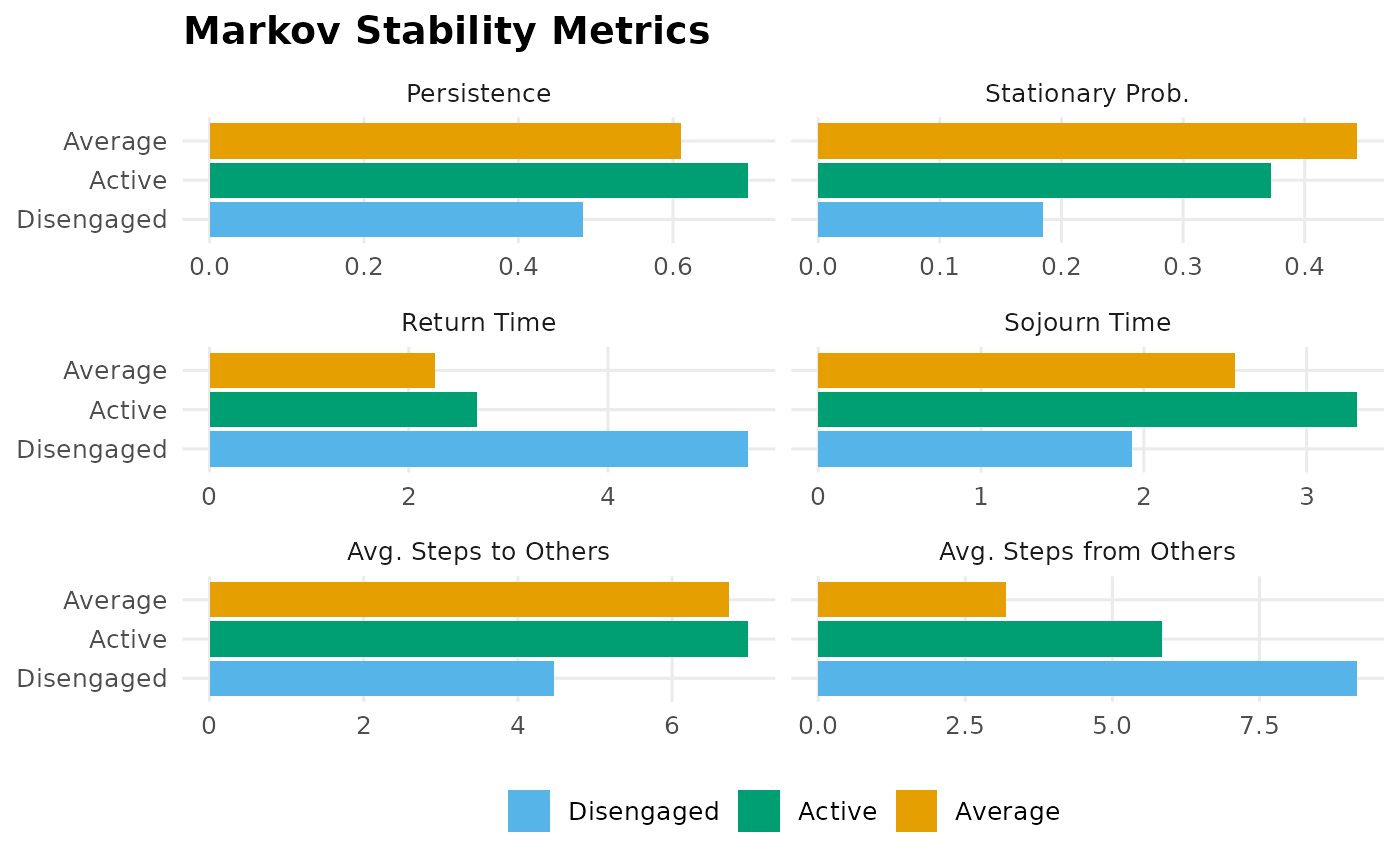
"persistence","stationary_prob","return_time","sojourn_time","avg_time_to_others","avg_time_from_others". Default: all six.- combined
When
TRUE(default), all selected metrics are shown in one ggplot viafacet_wrap(~ metric). WhenFALSE, returns a named list of single-panel ggplots, one per metric, so each can be printed, saved, or re-laid-out independently.
Value
An object of class "net_markov_stability" with:
- stability
Data frame with one row per state and columns:
state,persistence(\(P_{ii}\)),stationary_prob(\(\pi_i\)),return_time(\(1/\pi_i\)),sojourn_time(\(1/(1-P_{ii})\)),avg_time_to_others(mean MFPT leaving state \(i\)),avg_time_from_others(mean MFPT arriving at state \(i\)).- mpt
The underlying
net_mptobject.
For a netobject_group the result is a
"net_markov_stability_group": a named list holding one such
object per group.
In print.net_markov_stability(): x, invisibly.
In print.net_markov_stability_group(): x invisibly.
In plot.net_markov_stability(): plot.net_markov_stability returns a faceted ggplot object when combined = TRUE, and (invisibly) a named list of single-metric ggplots, one per entry of metrics, when combined = FALSE.
In summary.net_markov_stability(): the per-state stability table (the $stability data frame: one row per state with state, persistence, stationary_prob, return_time, sojourn_time, avg_time_to_others, avg_time_from_others), after printing the attractor and the most persistent state.
Details
Sojourn time is the expected consecutive time steps spent in a
state before leaving: \(1/(1-P_{ii})\). States with
persistence = 1 have sojourn_time = Inf.
avg_time_to_others: mean passage time from this state to all others; reflects how "sticky" or "isolated" the state is.
avg_time_from_others: mean passage time from all other states to this one; reflects accessibility (attractor strength).
Examples
net <- build_network(as.data.frame(trajectories), method = "relative")
ms <- markov_stability(net)
print(ms)
#> Markov Stability Analysis
#>
#> state persistence stationary_prob return_time sojourn_time
#> Active 0.6976 0.3719 2.69 3.31
#> Average 0.6099 0.4431 2.26 2.56
#> Disengaged 0.4831 0.1850 5.41 1.93
#> avg_time_to_others avg_time_from_others
#> 6.99 5.84
#> 6.74 3.20
#> 4.47 9.16
# \donttest{
plot(ms)
 # }
# }