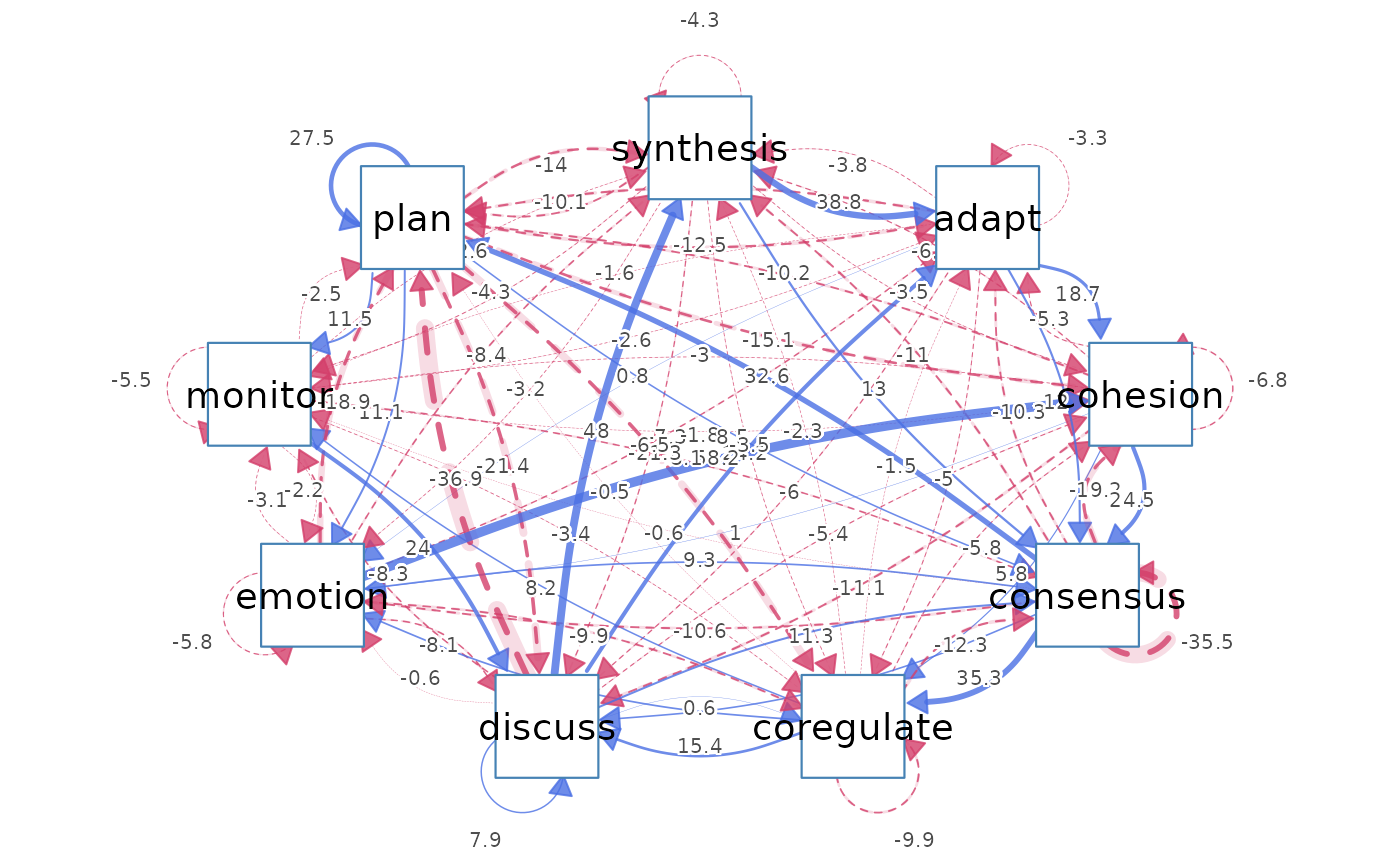
Draws the directed transition network of an lsa fit with
cograph::splot(). Pick the edge weight with weights; optionally
keep only significant edges. Nodes are white and edges are labelled
by default. Returns the cograph network invisibly.
Usage
plot_transitions(
  fit,
  weights = c("residuals", "tna", "relative", "count", "prob", "lift", "yules_q"),
  significant = FALSE,
  top = NULL,
  decimals = 1,
  node_fill = "white",
  edge_labels = TRUE,
  ...
)
Arguments
- fit
An
lsafit fromlsa().- weights
Which matrix becomes the edge weight, and how it is drawn:
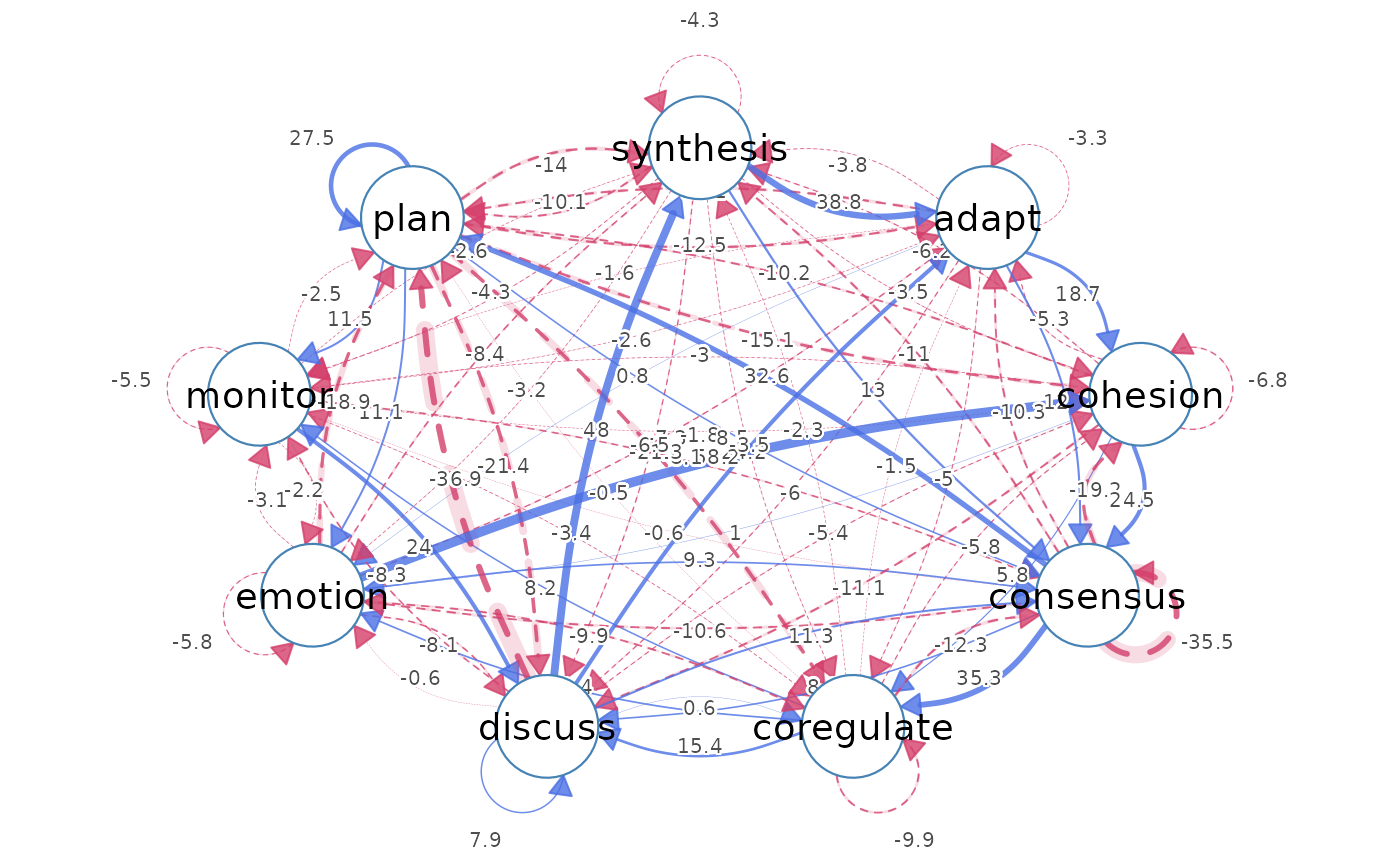
"residuals"(default) – a residual network (not a transition one): adjusted residuals coloured by sign on the TNA / Nestimate convention, blue = more (over-represented) solid and red = less (avoided) dashed with a soft halo."tna"/"relative"/"prob"/"count"– the familiar transition network of Transition Network Analysis (TNA), drawn withcograph::splot(tna_styling = TRUE): cograph's own TNA styling (coloured nodes, weighted directed edges) plus a donut ring per node carrying its initial-state probability, and edges labelled with the transition probability ("tna"/"relative"/"prob") or observed count ("count")."tna"and"relative"are explicit aliases for"prob". For probability/TNA networks, edges below0.05are dropped by default so weak transitions do not clutter the plot (override withedge_cutoff)."lift"– observed / expected, drawn in a single neutral colour with magnitude carried by edge width."yules_q"– a signed association network: Yule's Q on a fixed[-1, 1]scale, coloured by sign like the residual network (blue over-represented, red avoided) but bounded and not growing with sample size.
- significant
Logical. Keep only edges whose adjusted-residual p-value is below the fit's alpha; weaker cells are set to 0 (no edge). Default
FALSE. Note that at large sample sizes almost every cell is significant, so this is a weak visual filter – prefertop(effect-size pruning) to declutter a dense residual network.- top
Numeric or
NULL. Keep only the strongest edges by absolute weight (applied aftersignificant); the rest are set to 0. A fraction0 < top < 1keeps that proportion of the present edges (top = 0.5-> the strongest half); a valuetop >= 1keeps that many edges (top = 12-> the 12 strongest). The legible way to thin a dense residual network: it prunes by effect size (|adjusted residual|) rather than by p-value.NULL(default) keeps every edge. Applies to every view; for the probability network it composes with the defaultedge_cutoff = 0.05.- decimals
Number of decimal places for edge labels. Default
1.- node_fill
Node fill colour. Default
"white"; the probability / count networks use a per-state palette instead unlessnode_fillis set explicitly.- edge_labels
Logical (or a label vector). Show edge weights as labels. Default
TRUE.- ...
Passed to
cograph::splot()(e.g.node_shape,layout,edge_cutoff,curvature).
See also
plot.lsa() (heatmap), transitions(),
transition_probabilities()
Examples
fit <- lsa(group_regulation)
plot_transitions(fit) # residual network
 plot_transitions(fit, weights = "tna") # TNA probabilities
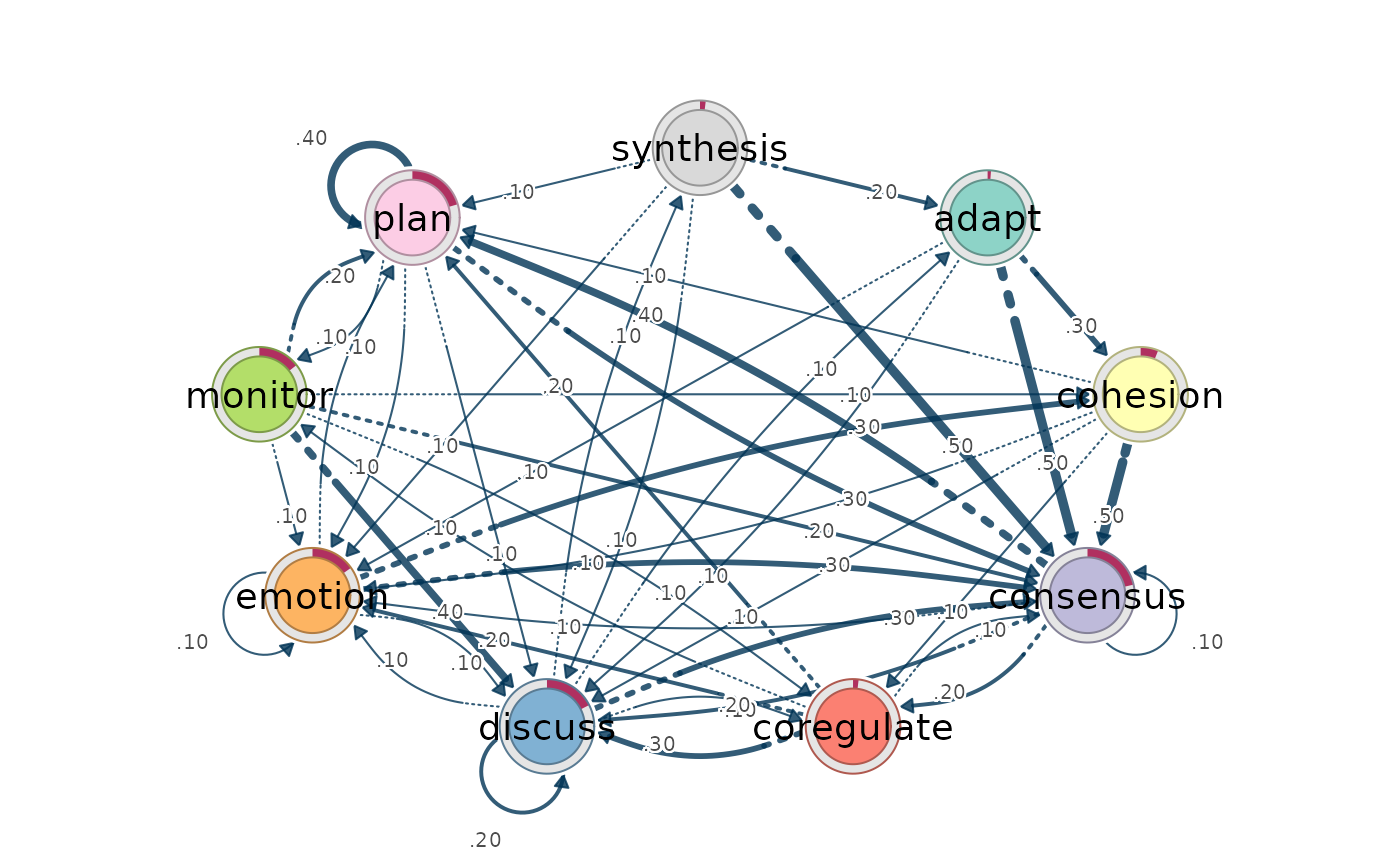 plot_transitions(fit, weights = "relative") # same as "tna"
plot_transitions(fit, weights = "prob") # same matrix
plot_transitions(fit, weights = "residuals", # residual network,
significant = TRUE) # significant only
plot_transitions(fit, weights = "relative") # same as "tna"
plot_transitions(fit, weights = "prob") # same matrix
plot_transitions(fit, weights = "residuals", # residual network,
significant = TRUE) # significant only
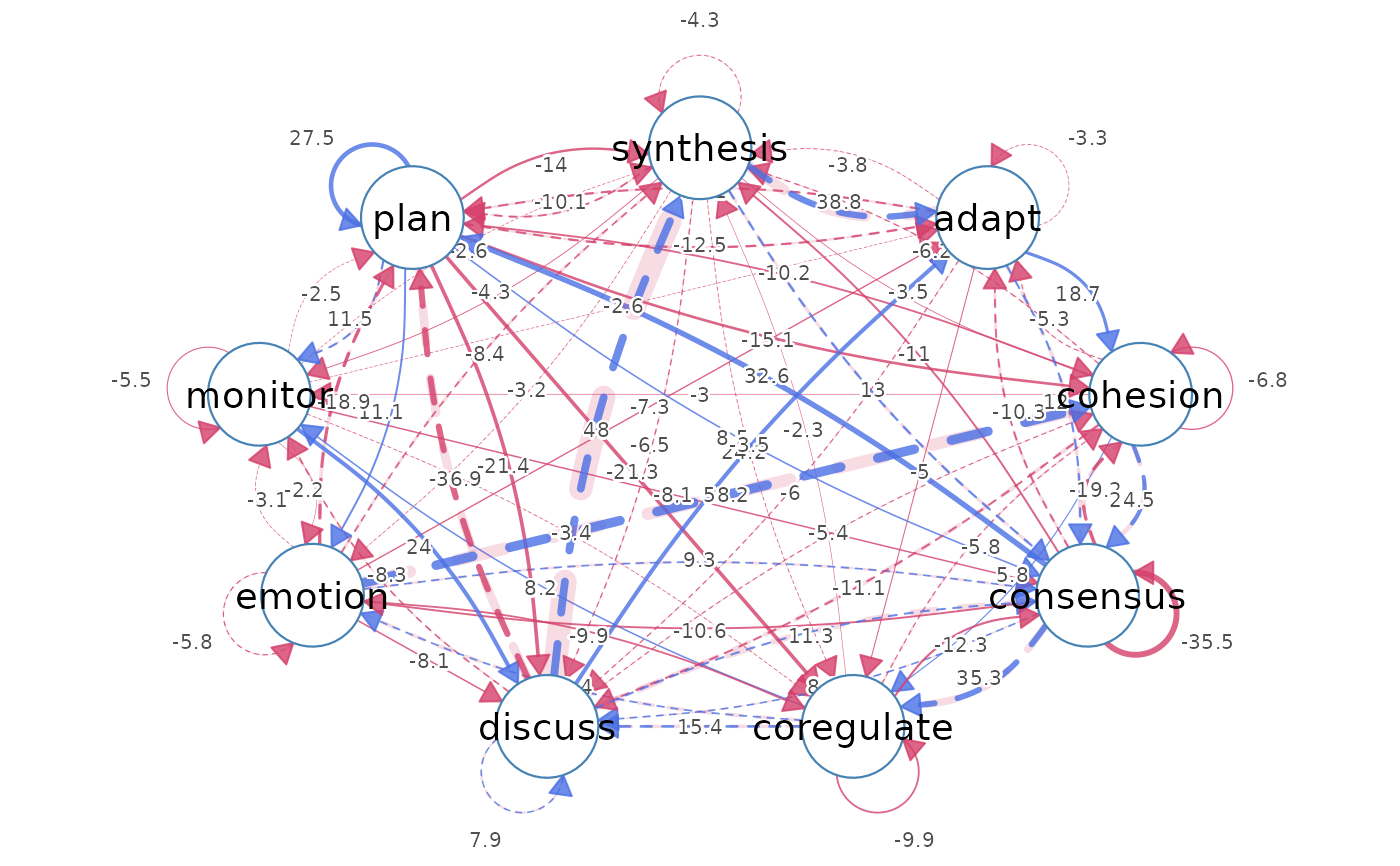 plot_transitions(fit, top = 12) # 12 strongest edges
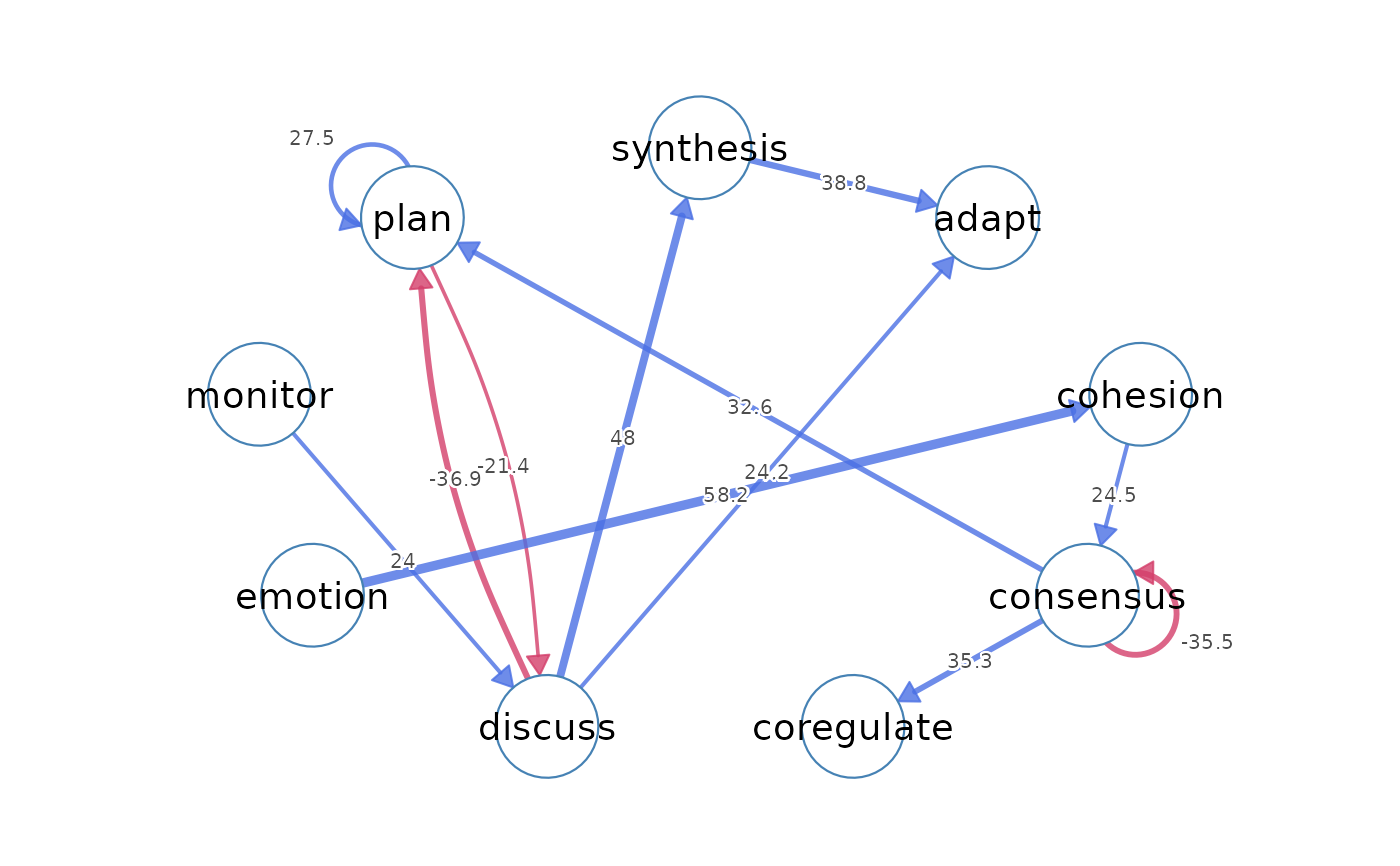 plot_transitions(fit, top = 0.5) # strongest 50%
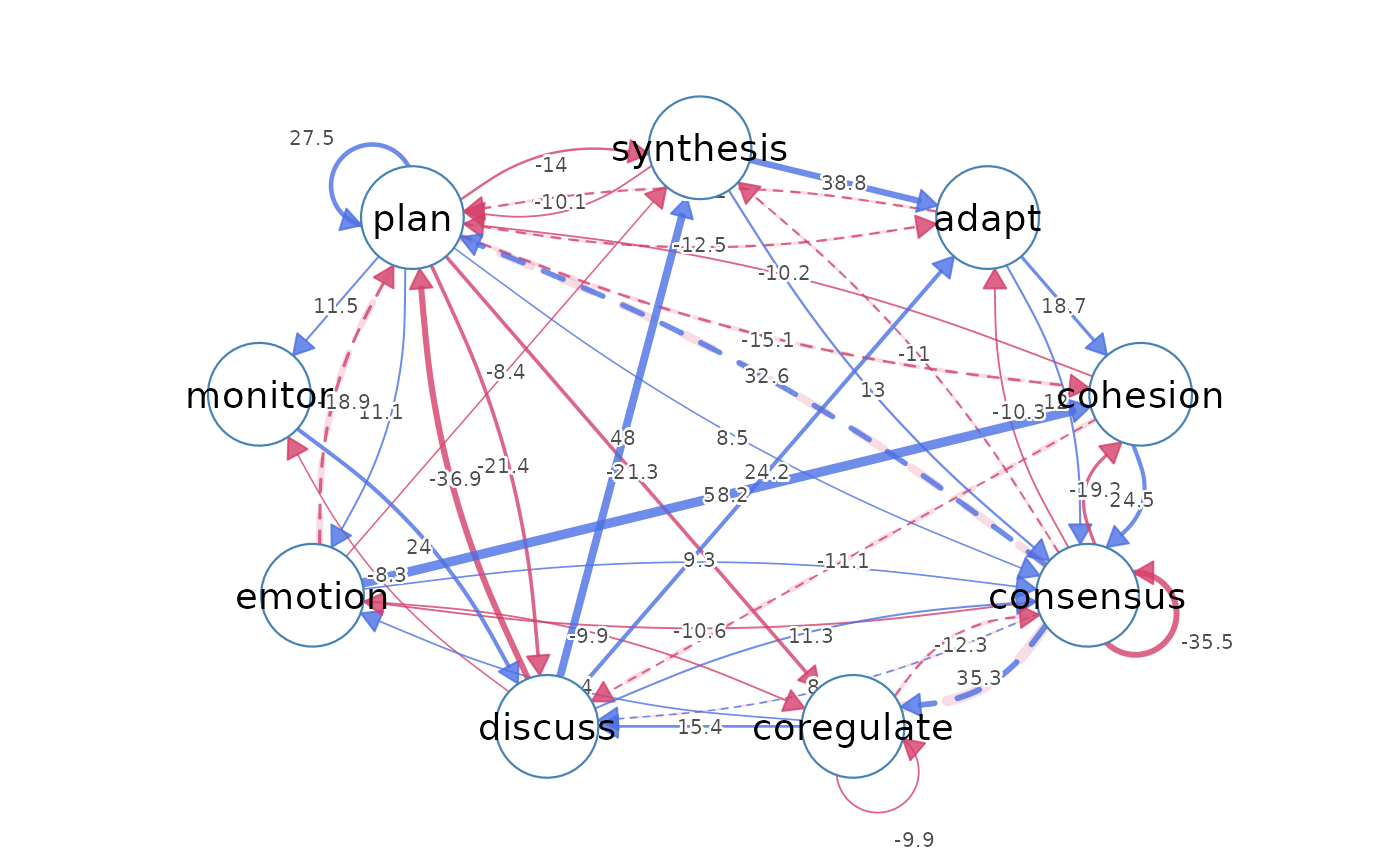 plot_transitions(fit, decimals = 2) # 2-dp edge labels
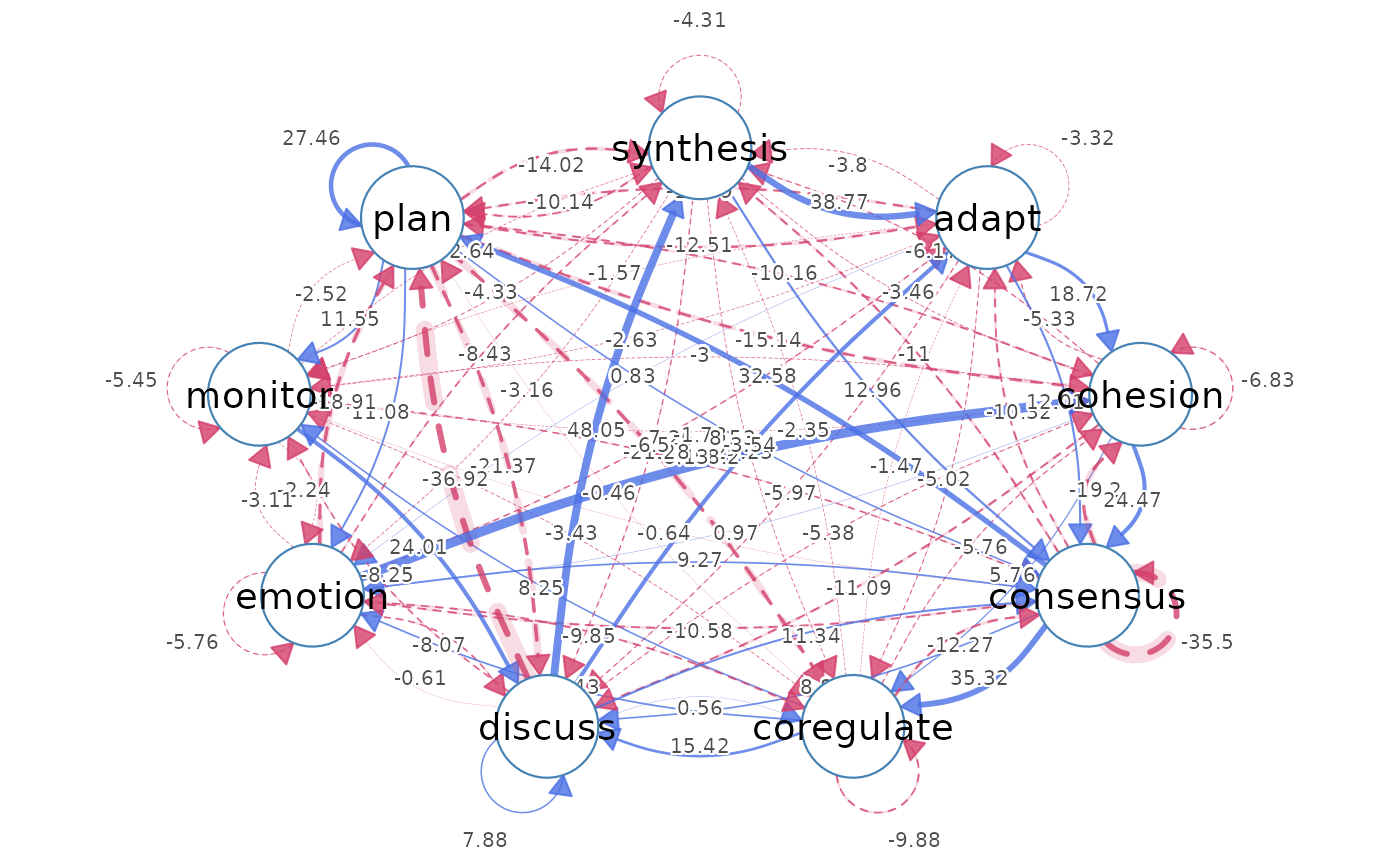 plot_transitions(fit, node_shape = "square") # splot passthrough