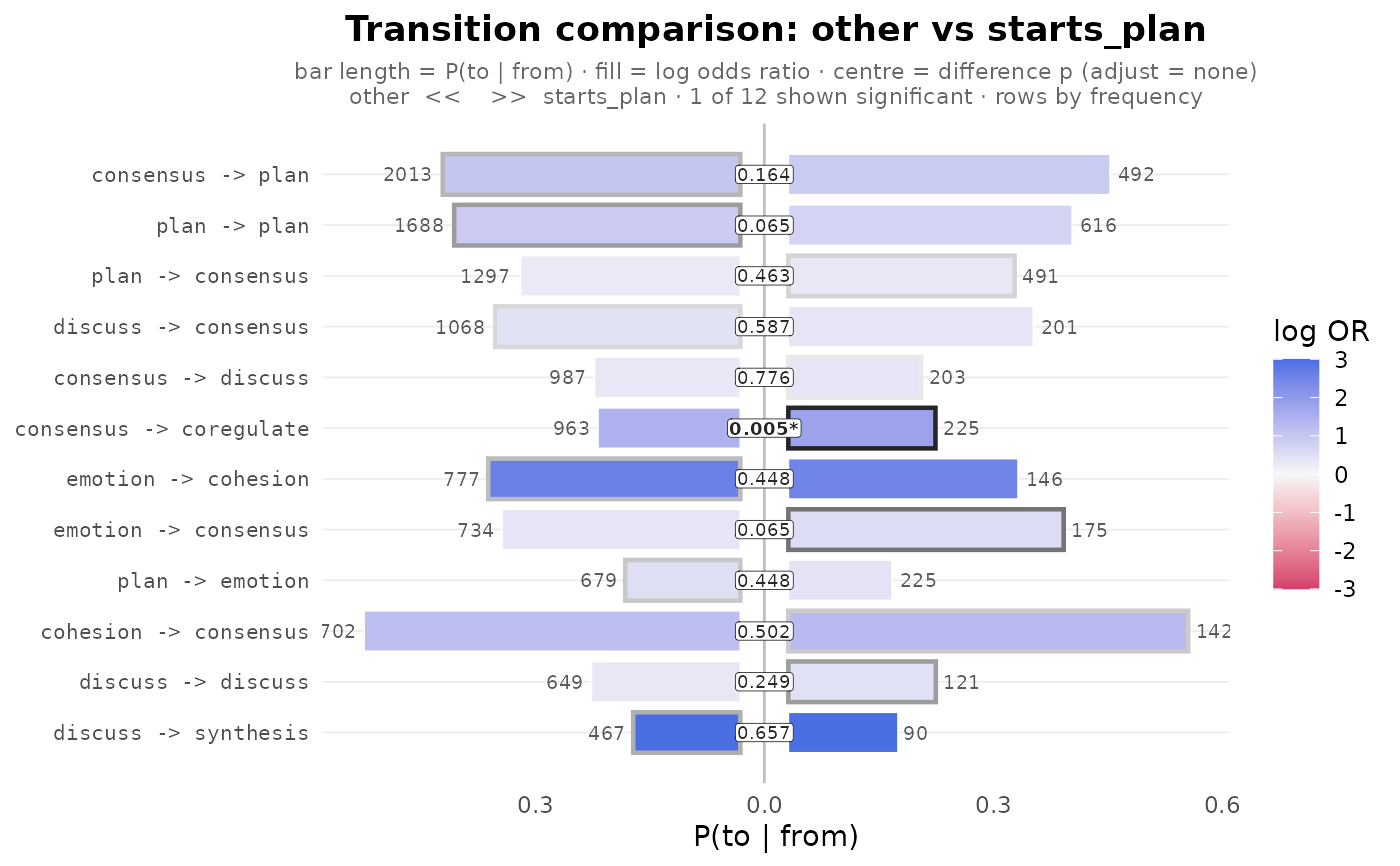
Two views of a compare_lsa() result. The default "barrel" is a
back-to-back pyramid (one row per transition): the first group's bar
runs left and the second's right, bar length is each group's
transition probability, bar colour is each group's log odds ratio
(blue = over-represented, red = avoided, following the vcd / mosaic
convention), bar ends show the observed count, and the centre chip
shows the difference p-value (bold and starred when significant). The
bar of the group with the higher value gets a border that darkens with
the size of the difference (faint = small, dark = large). For more
than two groups, one
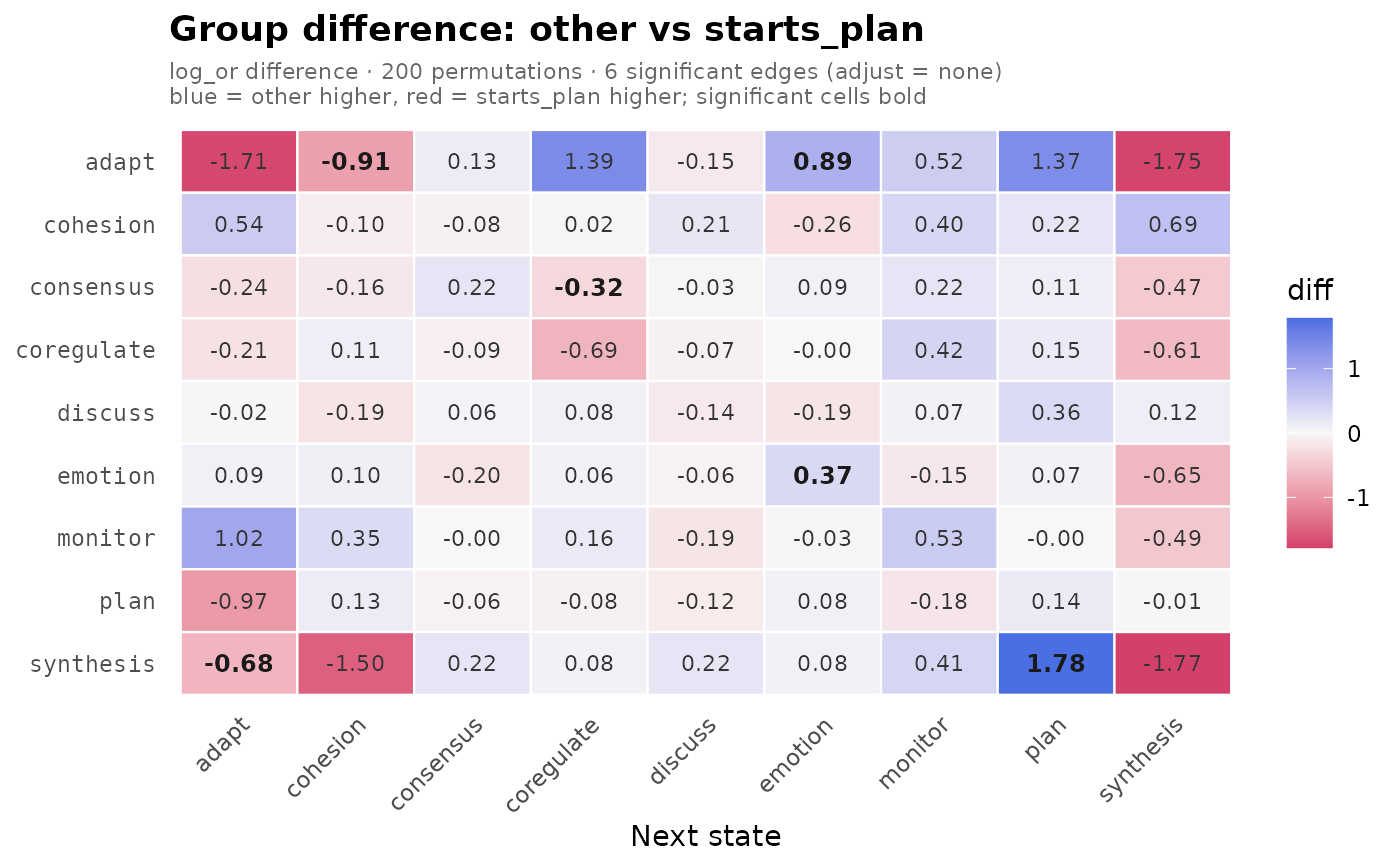
barrel is drawn per pair via facets. The "heatmap" style draws the
signed difference as a from x to grid on the same diverging scale.
Usage
# S3 method for class 'lsa_comparison'
plot(
  x,
  style = c("barrel", "heatmap"),
  value = c("prob", "count"),
  rank = c("frequency", "effect"),
  top_n = 12L,
  ...
)

# S3 method for class 'lsa_comparison_pairwise'
plot(
  x,
  style = c("barrel", "heatmap"),
  value = c("prob", "count"),
  rank = c("frequency", "effect"),
  top_n = 12L,
  ...
)
Arguments
- x
An
lsa_comparisonorlsa_comparison_pairwiseobject.- style
"barrel"(default) or"heatmap".- value
For
"barrel", the quantity mapped to bar length:"prob"(transition probability, default) or"count".- rank
For
"barrel", how to choose which transitions to show:"frequency"(default) ranks by pooled observed count – the backbone transitions, which are mostly over-represented (blue);"effect"ranks by the strongest association in either group (|log OR|, among tested cells), surfacing both over- (blue) and under-represented / avoided (red) transitions.- top_n
For
"barrel", how many transitions to show (highestrankon top; for the pairwise object the ranking is shared across facets so they line up). Default12.- ...
Reserved.
Examples
# \donttest{
grp <- ifelse(group_regulation$T1 == "plan", "starts_plan", "other")
g <- lsa(group_regulation, group = grp)
cmp <- compare_lsa(g, R = 200)
plot(cmp) # back-to-back barrel
 plot(cmp, style = "heatmap") # difference heatmap
 # }
# }