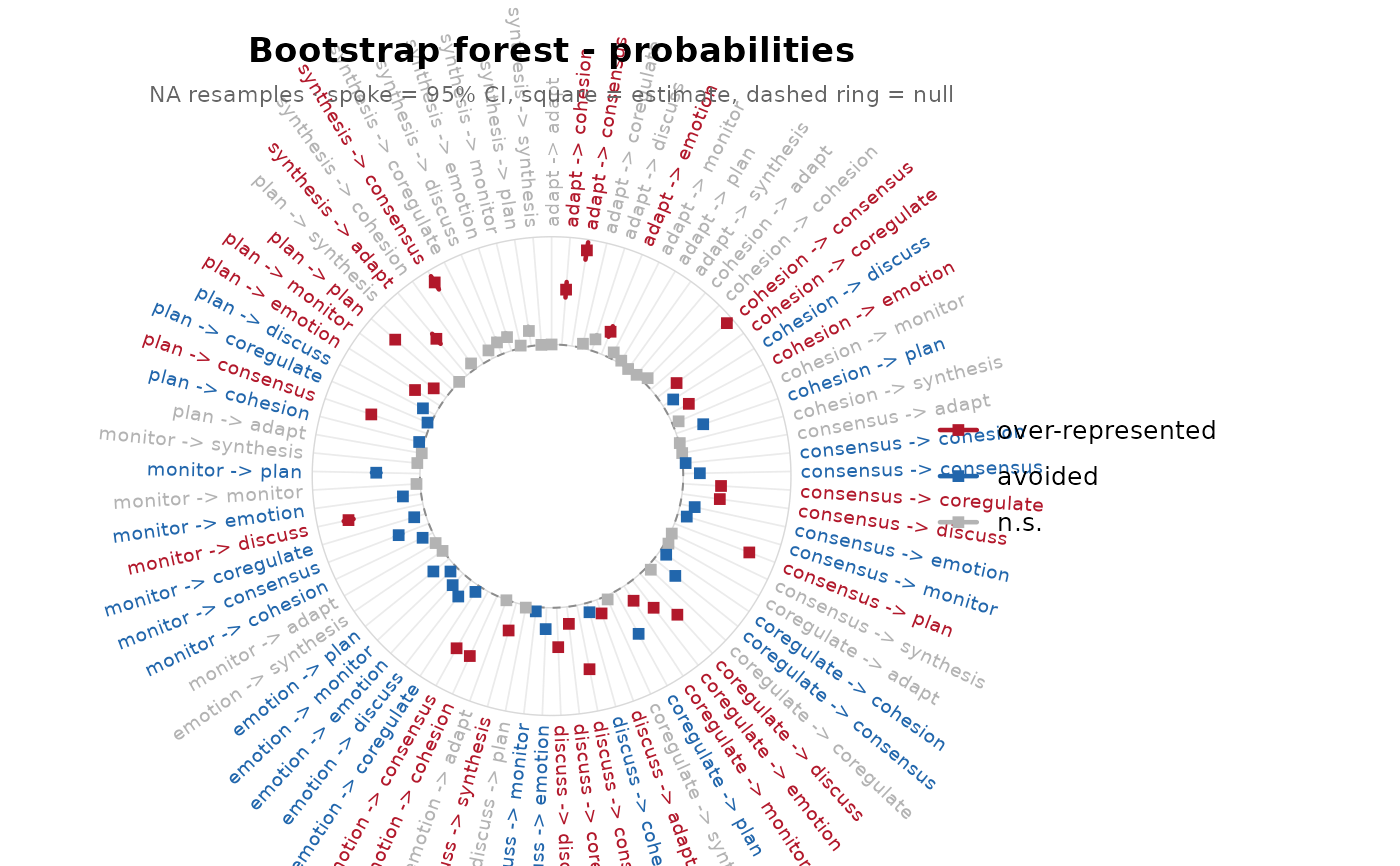
Circular forest of the per-edge transition-probability credible
intervals from certainty_lsa() (delegates to plot_forest() with
metric = "prob").
Usage
# S3 method for class 'lsa_certainty'
plot(x, metric = "prob", ...)
Arguments
- x
An
lsa_certaintyobject.- metric
Which credible interval to draw. Default
"prob".- ...
Passed to
plot_forest().
Examples
fit <- lsa(group_regulation)
cert <- certainty_lsa(fit)
plot(cert)