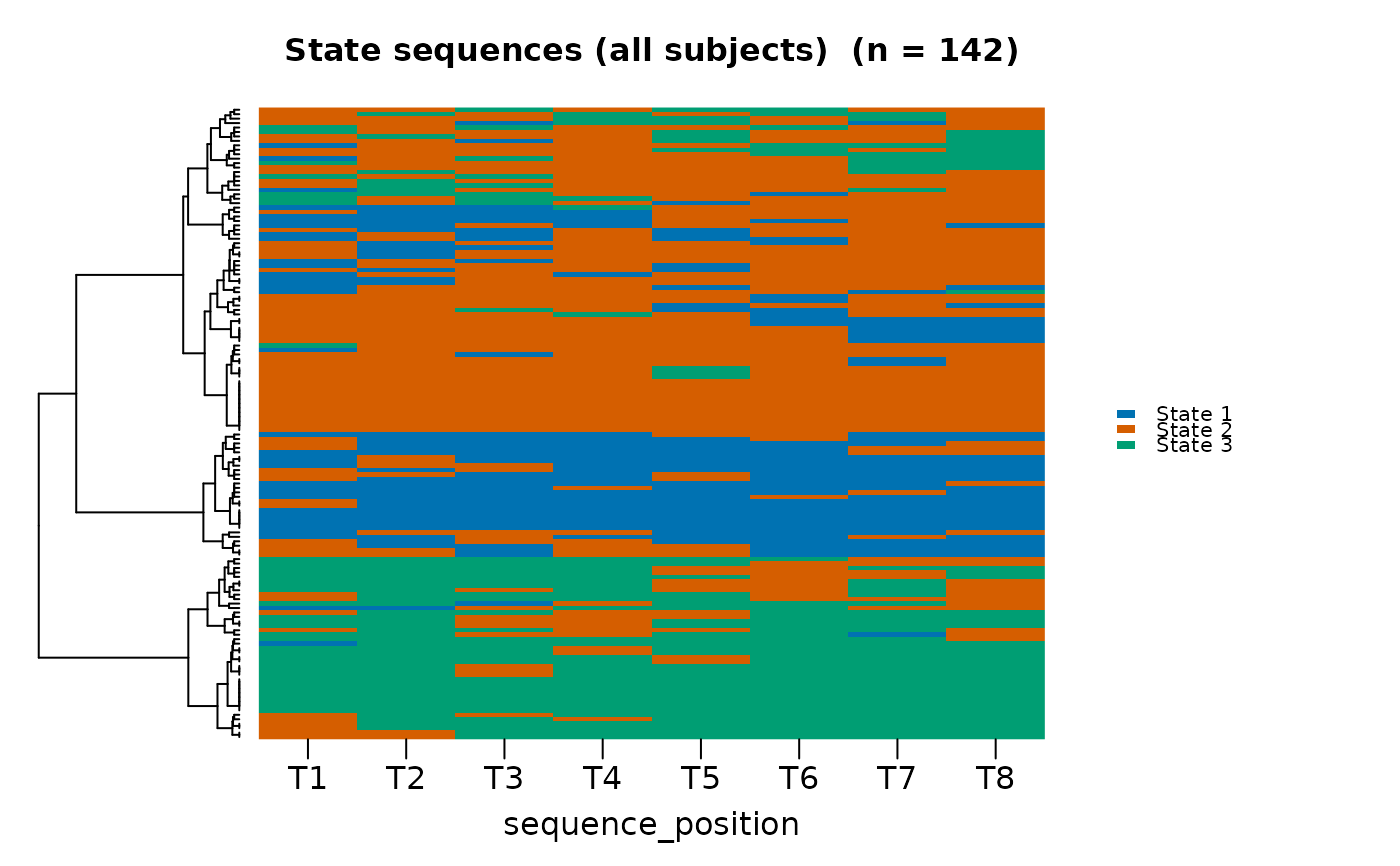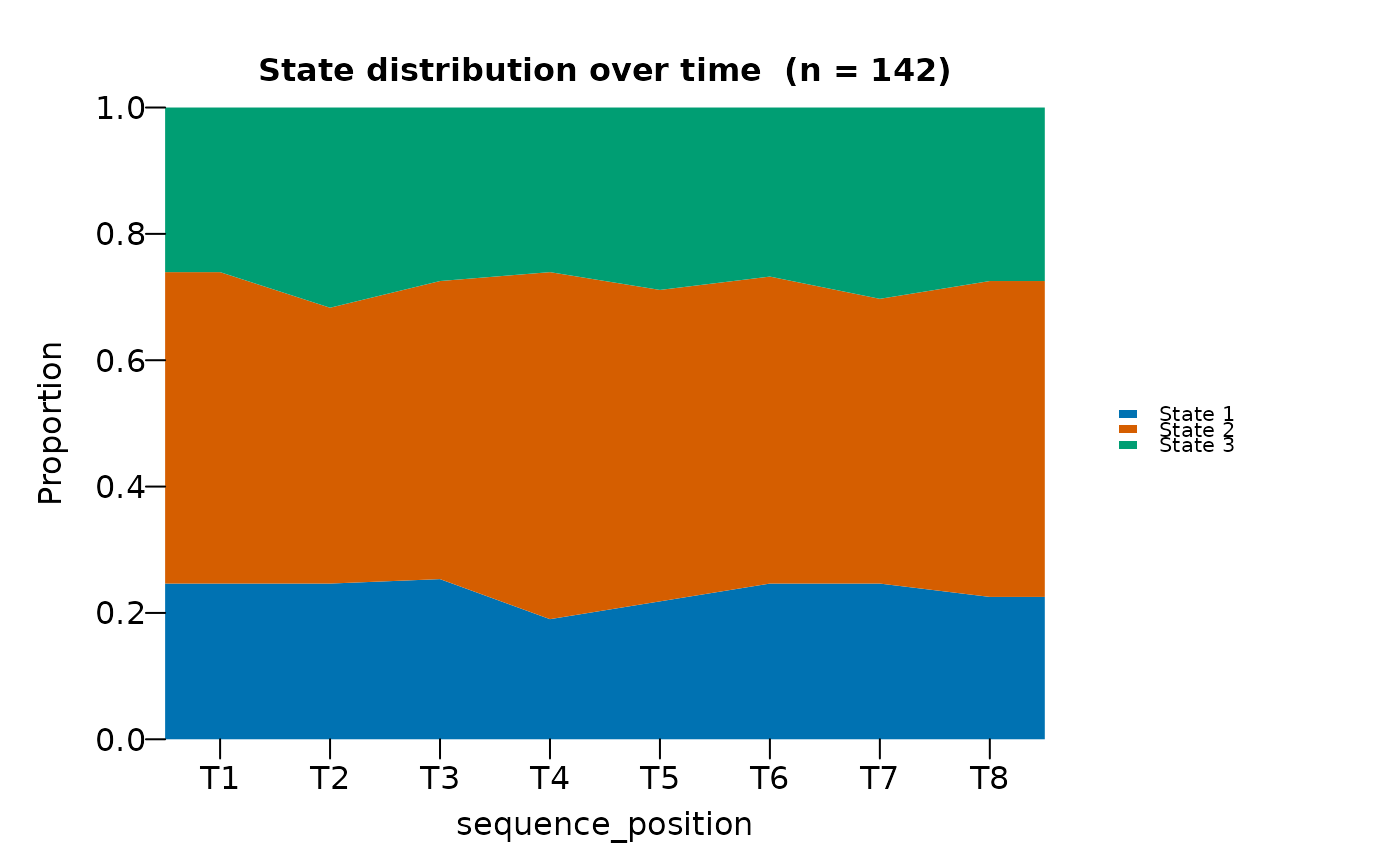
Delegates sequence index, distribution, and heatmap rendering to
Nestimate::sequence_plot().
Arguments
- x
A
vasstra_sequencesobject.- type
One of
"heatmap"(default),"distribution", or"index". The heatmap shows every aligned sequence at full resolution and is the most informative single view of the complete cohort.- colors
Optional colors, one per state, passed to Nestimate as
state_colors.- main
Plot title. A type-specific title is used by default.
- sort
Sequence ordering passed to
Nestimate::sequence_plot().- na
Show missing cells as a separate distribution band. By default, this is
TRUEonly when the sequence data containNA.- ...
Additional arguments passed to
Nestimate::sequence_plot().
Value
The value returned by Nestimate::sequence_plot().
See also
flow_plot() for alluvial and individual flow views.