
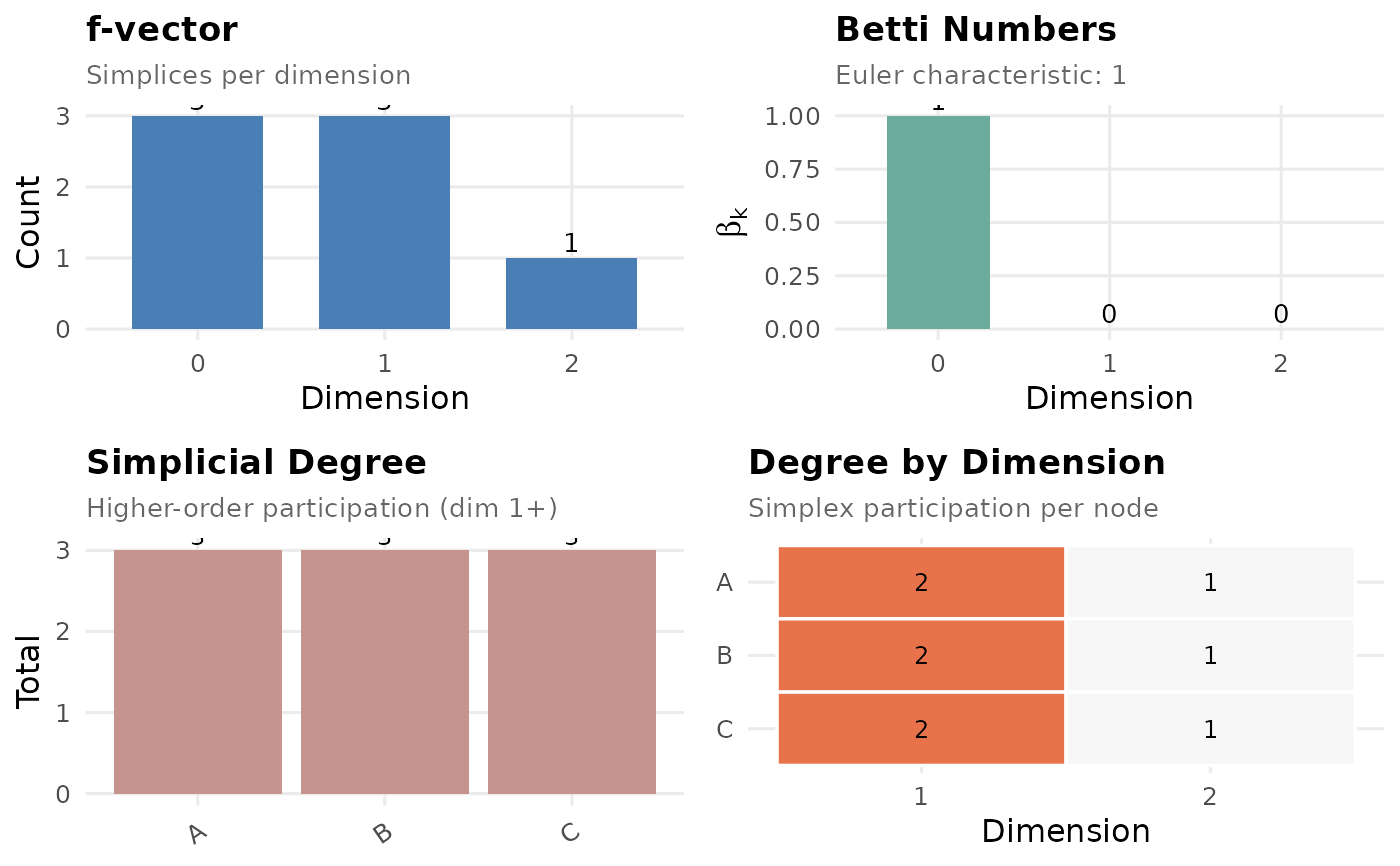
Produces a multi-panel summary: f-vector, simplicial degree ranking, and degree-by-dimension heatmap.
Usage
# S3 method for class 'simplicial_complex'
plot(x, combined = TRUE, ...)
Arguments
- x
A
simplicial_complexobject.- combined
When
TRUE(default), the four panels are stitched into a 2x2 gtable viagridExtra::arrangeGroband drawn. WhenFALSE, returns a named list of the four ggplots (f_vector,betti,degree,degree_heatmap) so each can be printed, saved, or re-laid-out independently.- ...
Ignored.
Value
A grid grob (invisibly) when combined = TRUE; a named list of
four ggplots when combined = FALSE.
Examples
# \donttest{
mat <- matrix(c(0,.6,.5,.6,0,.4,.5,.4,0), 3, 3)
colnames(mat) <- rownames(mat) <- c("A","B","C")
sc <- build_simplicial(mat, threshold = 0.3)
if (requireNamespace("gridExtra", quietly = TRUE)) plot(sc)
 # }
# }