
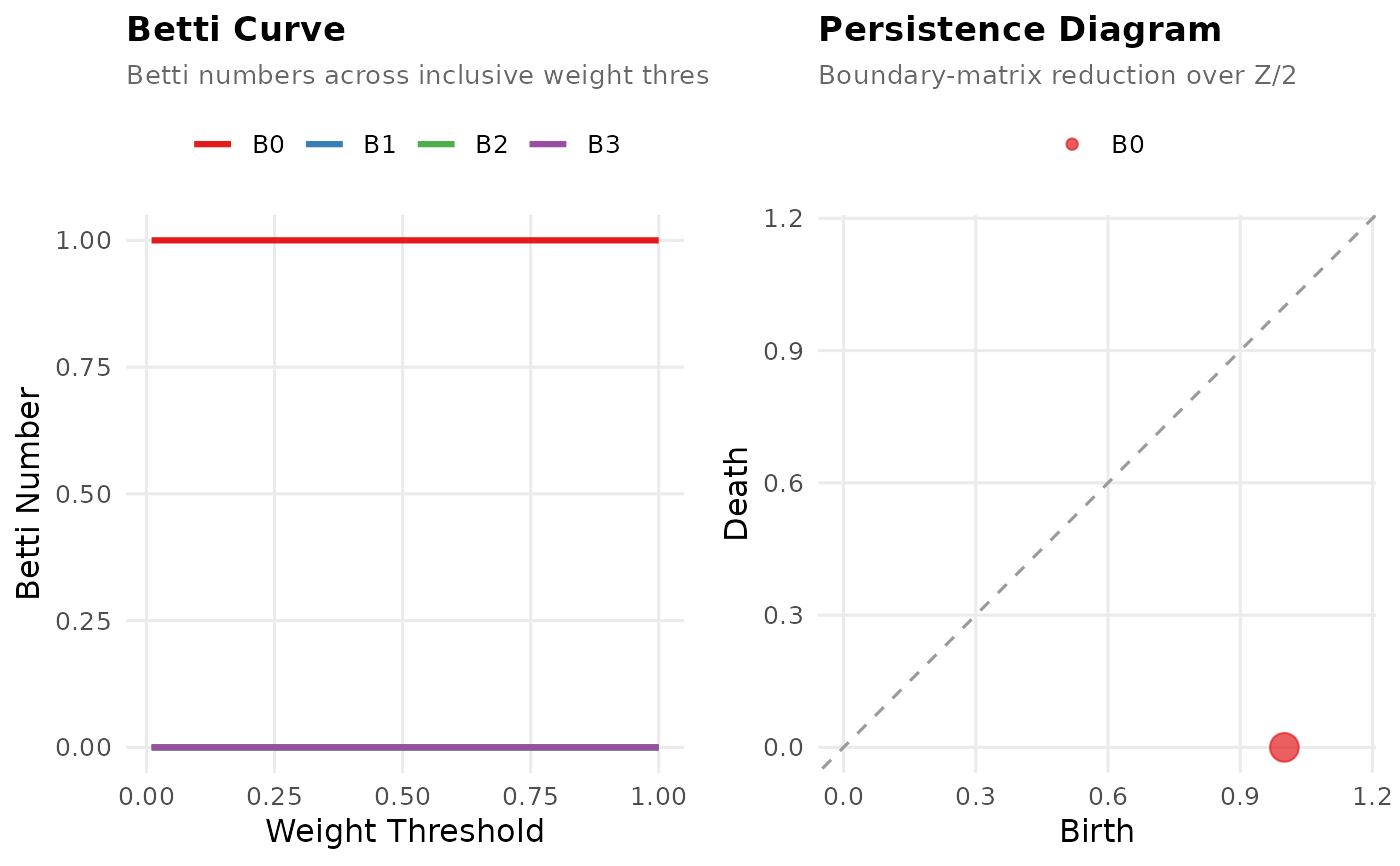
Two panels: Betti curve (threshold vs Betti number) and persistence
diagram (birth vs death). Persistence pairs come from full boundary-
matrix reduction; essential classes are shown at the filtration boundary
(death = 0 in clique mode, death = max_scale in VR mode).
Usage
# S3 method for class 'persistent_homology'
plot(x, combined = TRUE, ...)
Arguments
- x
A
persistent_homologyobject.- combined
When
TRUE(default), the two panels are stitched side-by-side viagridExtra::arrangeGrob. WhenFALSE, returns a named list (betti_curve,persistence) of ggplots.- ...
Ignored.
Value
A grid grob (invisibly) when combined = TRUE; a named list
of two ggplots when combined = FALSE.
Examples
# \donttest{
seqs <- data.frame(
V1 = c("A","B","C","A","B"),
V2 = c("B","C","A","B","C"),
V3 = c("C","A","B","C","A")
)
net <- build_network(seqs, method = "relative")
ph <- persistent_homology(net)
if (requireNamespace("gridExtra", quietly = TRUE)) plot(ph)
 # }
# }