
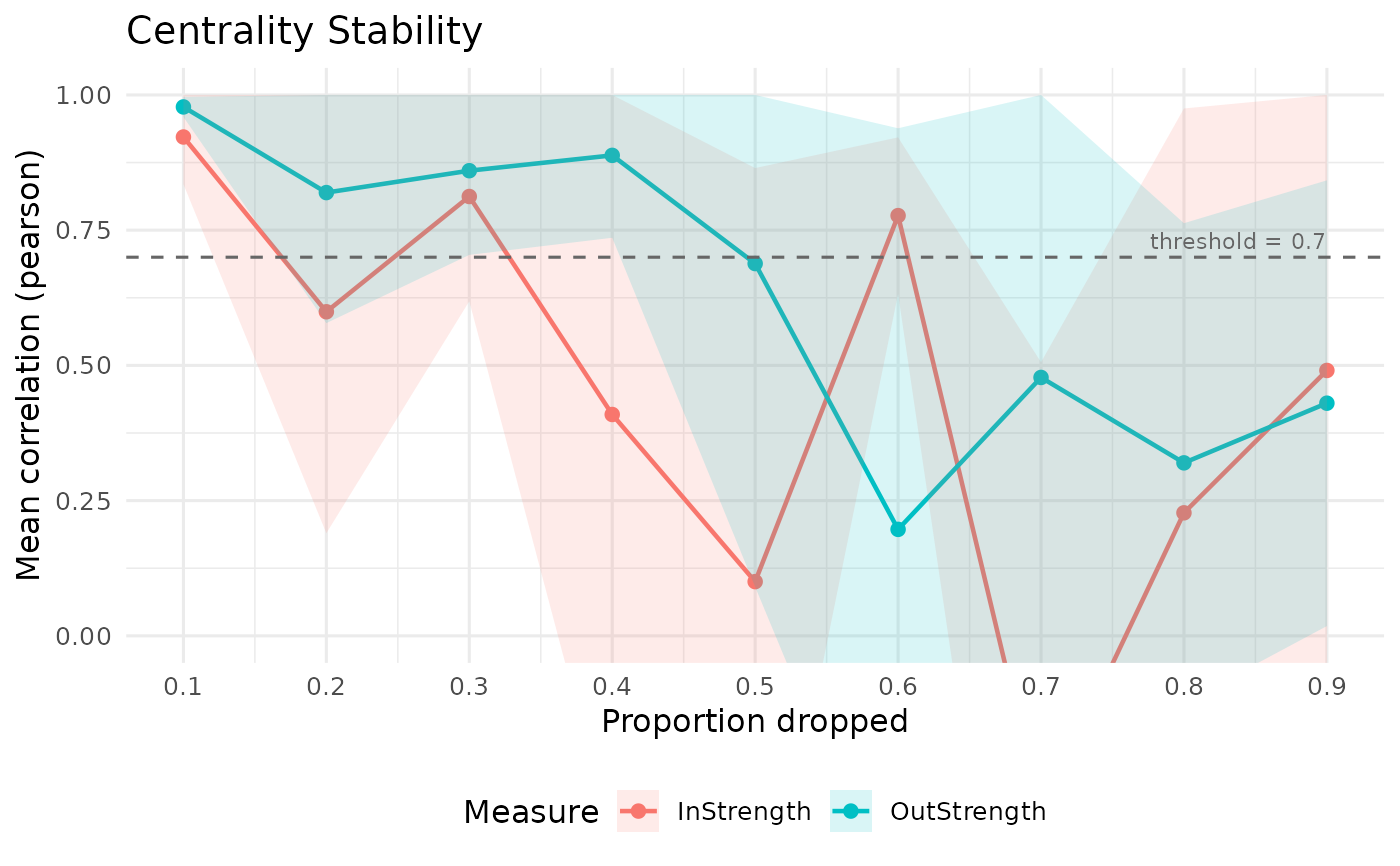
Plots mean correlation vs drop proportion for each centrality measure. The CS-coefficient is marked where the curve crosses the threshold.
Usage
# S3 method for class 'net_stability'
plot(x, ...)Examples
net <- build_network(data.frame(V1 = c("A","B","C","A"),
V2 = c("B","C","A","B")), method = "relative")
cs <- centrality_stability(net, iter = 10, drop_prop = 0.3)
#> Warning: All centrality measures have zero variance. No stability can be assessed.
plot(cs)
#> Warning: Removed 3 rows containing missing values or values outside the scale range
#> (`geom_line()`).
#> Warning: Removed 3 rows containing missing values or values outside the scale range
#> (`geom_point()`).
#> Warning: Removed 3 rows containing missing values or values outside the scale range
#> (`geom_ribbon()`).
 # \donttest{
set.seed(1)
seqs <- data.frame(
V1 = sample(c("A","B","C"), 30, TRUE),
V2 = sample(c("A","B","C"), 30, TRUE),
V3 = sample(c("A","B","C"), 30, TRUE)
)
net <- build_network(seqs, method = "relative")
stab <- centrality_stability(net, measures = c("InStrength","OutStrength"),
iter = 10)
plot(stab)
# \donttest{
set.seed(1)
seqs <- data.frame(
V1 = sample(c("A","B","C"), 30, TRUE),
V2 = sample(c("A","B","C"), 30, TRUE),
V3 = sample(c("A","B","C"), 30, TRUE)
)
net <- build_network(seqs, method = "relative")
stab <- centrality_stability(net, measures = c("InStrength","OutStrength"),
iter = 10)
plot(stab)
 # }
# }