
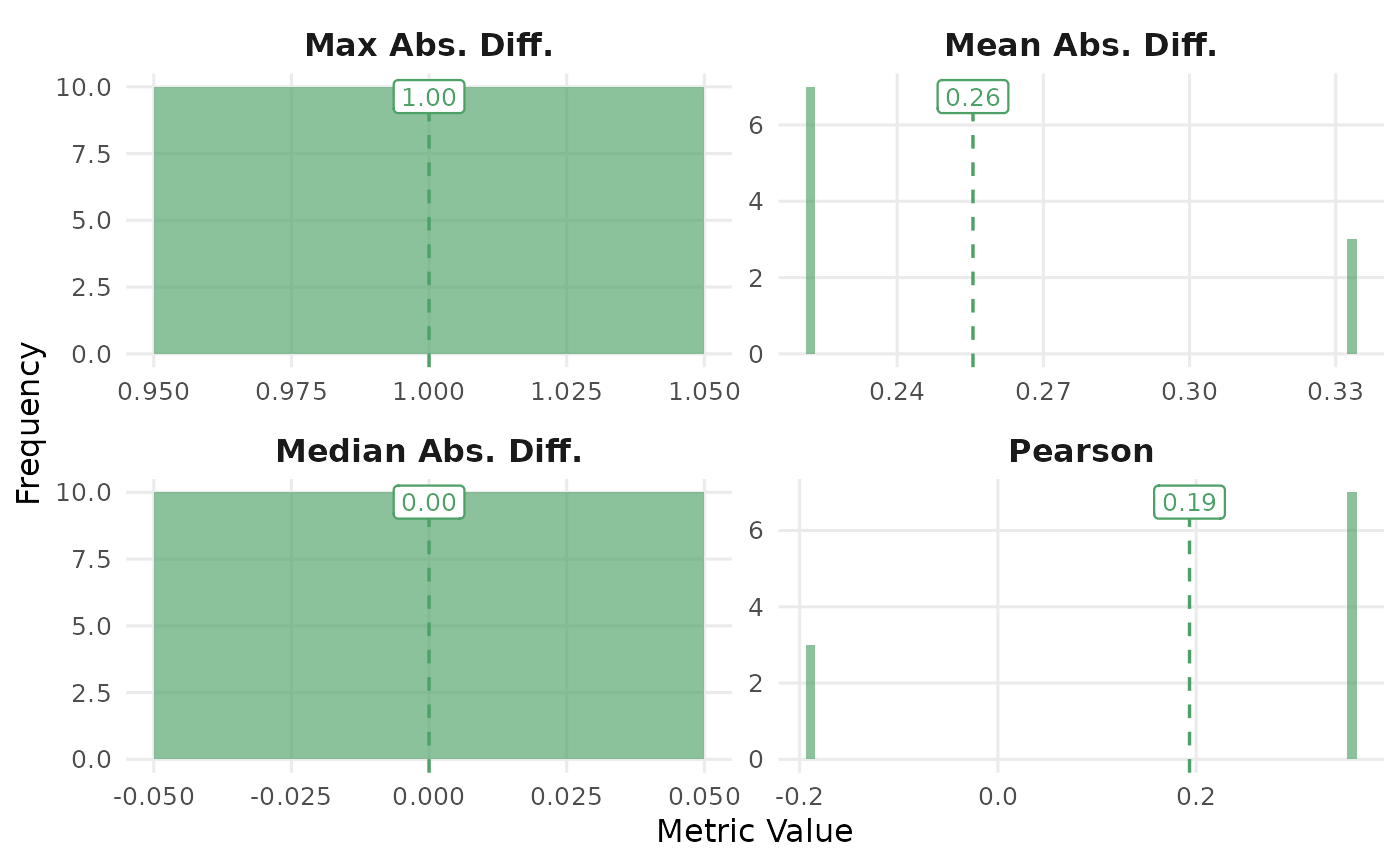
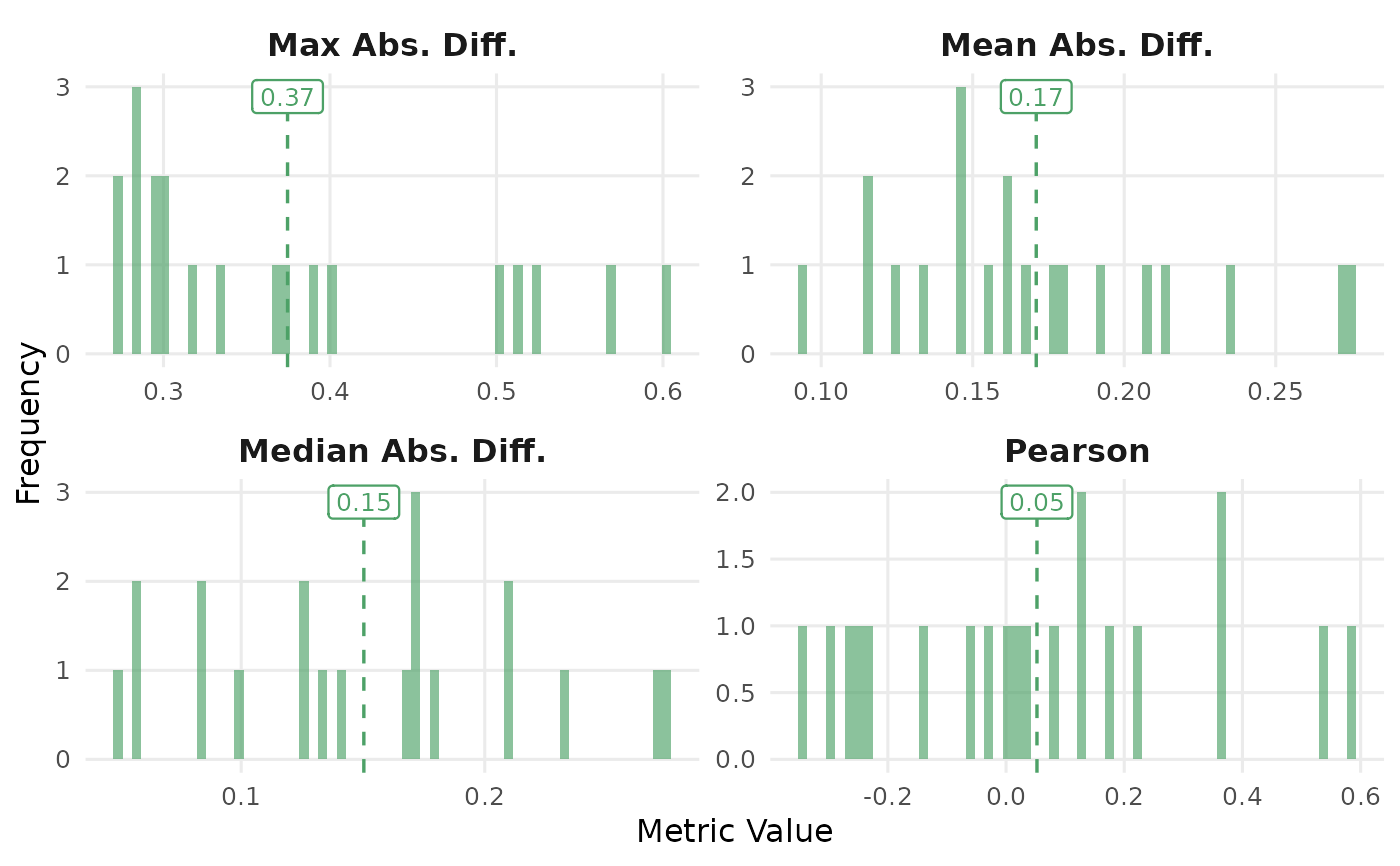
Density plots of split-half metrics faceted by metric type. Multi-model comparisons show overlaid densities colored by model.
Usage
# S3 method for class 'net_reliability'
plot(x, bins = 60L, combined = TRUE, ...)
Arguments
- x
A
net_reliabilityobject.- bins
Integer. Number of histogram bins per panel (default 60).
- combined
When
TRUE(default), all four metrics are shown in one ggplot viafacet_wrap(~ metric). WhenFALSE, returns a named list of four single-panel ggplots, one per metric.- ...
Additional arguments (ignored).
Examples
net <- build_network(data.frame(V1 = c("A","B","C","A"),
V2 = c("B","C","A","B")), method = "relative")
rel <- network_reliability(net, iter = 10)
plot(rel)
 # \donttest{
set.seed(1)
seqs <- data.frame(
V1 = sample(c("A","B","C"), 30, TRUE),
V2 = sample(c("A","B","C"), 30, TRUE),
V3 = sample(c("A","B","C"), 30, TRUE)
)
net <- build_network(seqs, method = "relative")
rel <- network_reliability(net, iter = 20, seed = 1)
plot(rel)
# \donttest{
set.seed(1)
seqs <- data.frame(
V1 = sample(c("A","B","C"), 30, TRUE),
V2 = sample(c("A","B","C"), 30, TRUE),
V3 = sample(c("A","B","C"), 30, TRUE)
)
net <- build_network(seqs, method = "relative")
rel <- network_reliability(net, iter = 20, seed = 1)
plot(rel)
 # }
# }