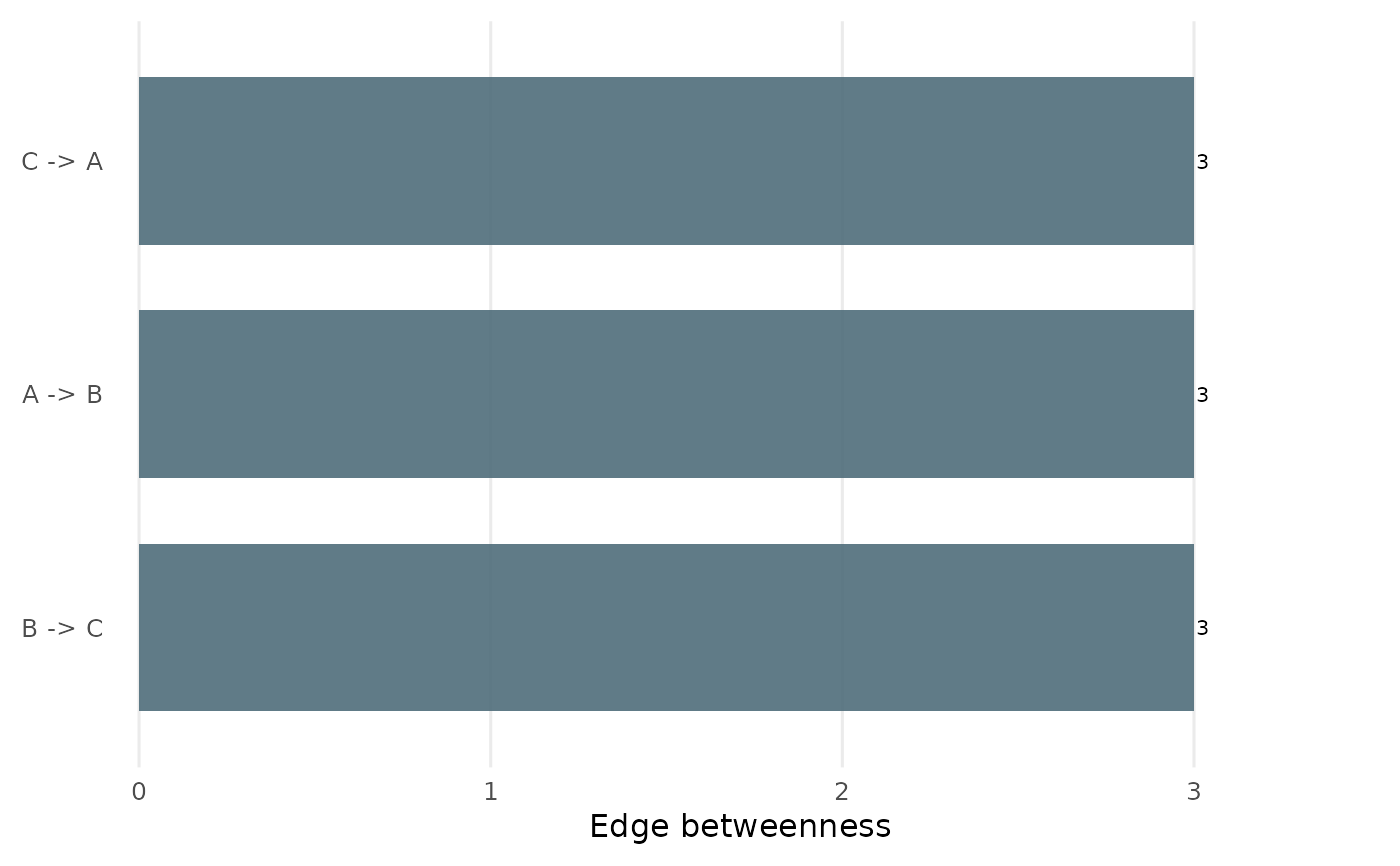
Draws the edges of a net_edge_betweenness network ranked by
their betweenness, as a horizontal bar chart. This is the tidy,
cograph-free companion to the node-link diagram: render the diagram with
cograph::splot(eb) and the ranking with plot(eb).
Arguments
- x
A
net_edge_betweennessnetwork fromnet_edge_betweenness.- style
Plot style.
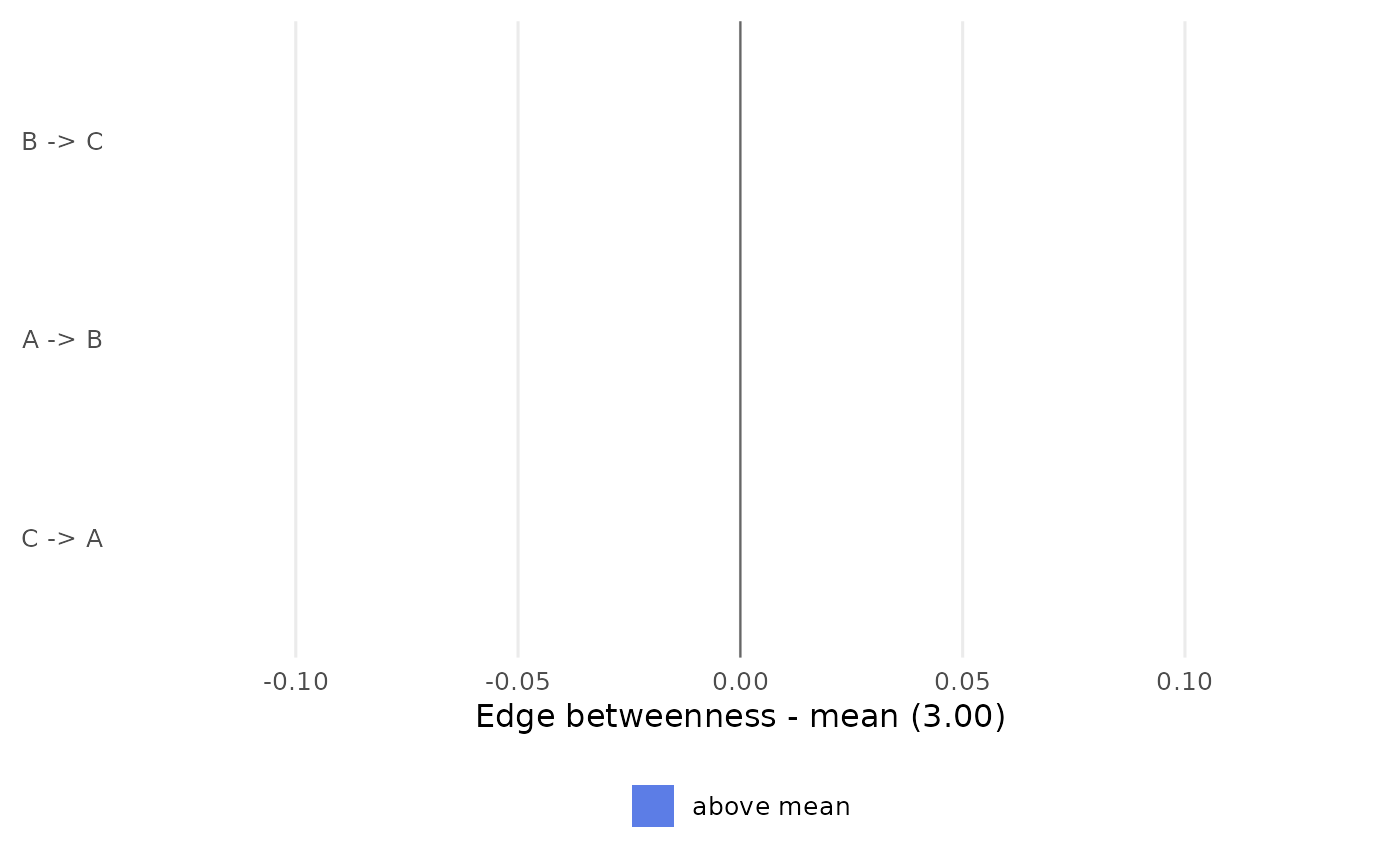
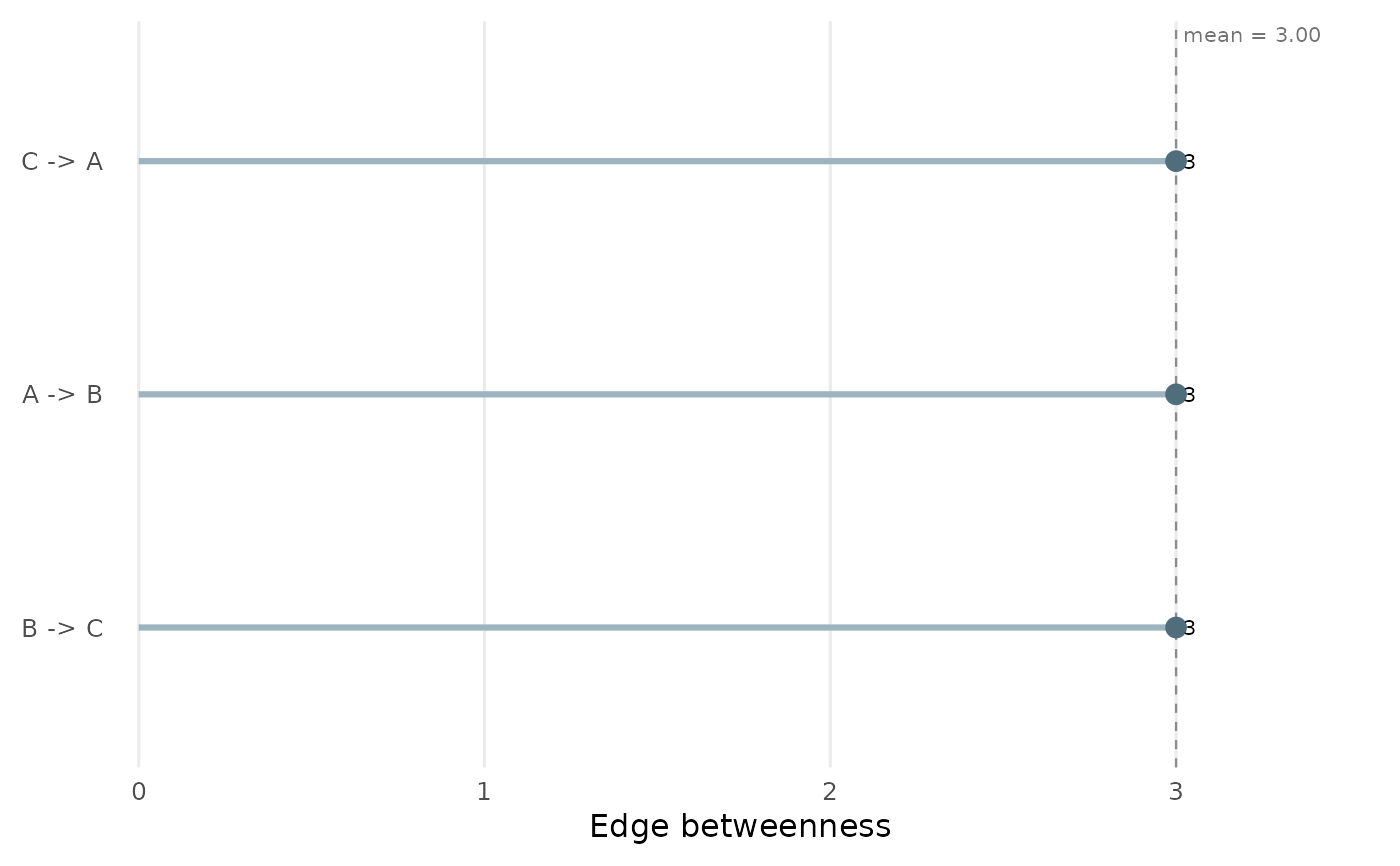
"bar"(default) draws one horizontal bar per edge;"forest"draws a forest/lollipop chart (a stem from zero to a point) with a dashed reference line at the mean betweenness;"delta"draws each edge's deviation from the mean edge betweenness as a diverging bar (above the mean in blue, below in red).- top_n
Integer or
NULL. Keep only thetop_nhighest edges. DefaultNULL(all edges with non-zero betweenness).- labels
Logical. Print the betweenness value beside each edge. Default
TRUE.- ...
Additional arguments (ignored).
Examples
seqs <- data.frame(
V1 = c("A","B","A","C"), V2 = c("B","C","B","A"),
V3 = c("C","A","C","B"))
eb <- net_edge_betweenness(build_network(seqs, method = "relative"))
plot(eb)
 plot(eb, style = "forest")
 plot(eb, style = "delta")