
Plot Sequence Clustering Results
Arguments
- x
A
net_clusteringobject.- type
Character. Plot type:
"silhouette"(per-observation silhouette bars),"mds"(2D MDS projection), or"heatmap"(distance matrix heatmap ordered by cluster). Default:"silhouette".- combined
Logical. For
type = "predictors"only: whenTRUE(default), covariate forest panels are combined into a single faceted plot; whenFALSE, a list of separate ggplots is returned.- ...
Unsupported. Supplying unused arguments raises an error.
Examples
seqs <- data.frame(V1 = c("A","B","C","A","B"), V2 = c("B","C","A","B","A"),
V3 = c("C","A","B","C","B"))
cl <- build_clusters(seqs, k = 2)
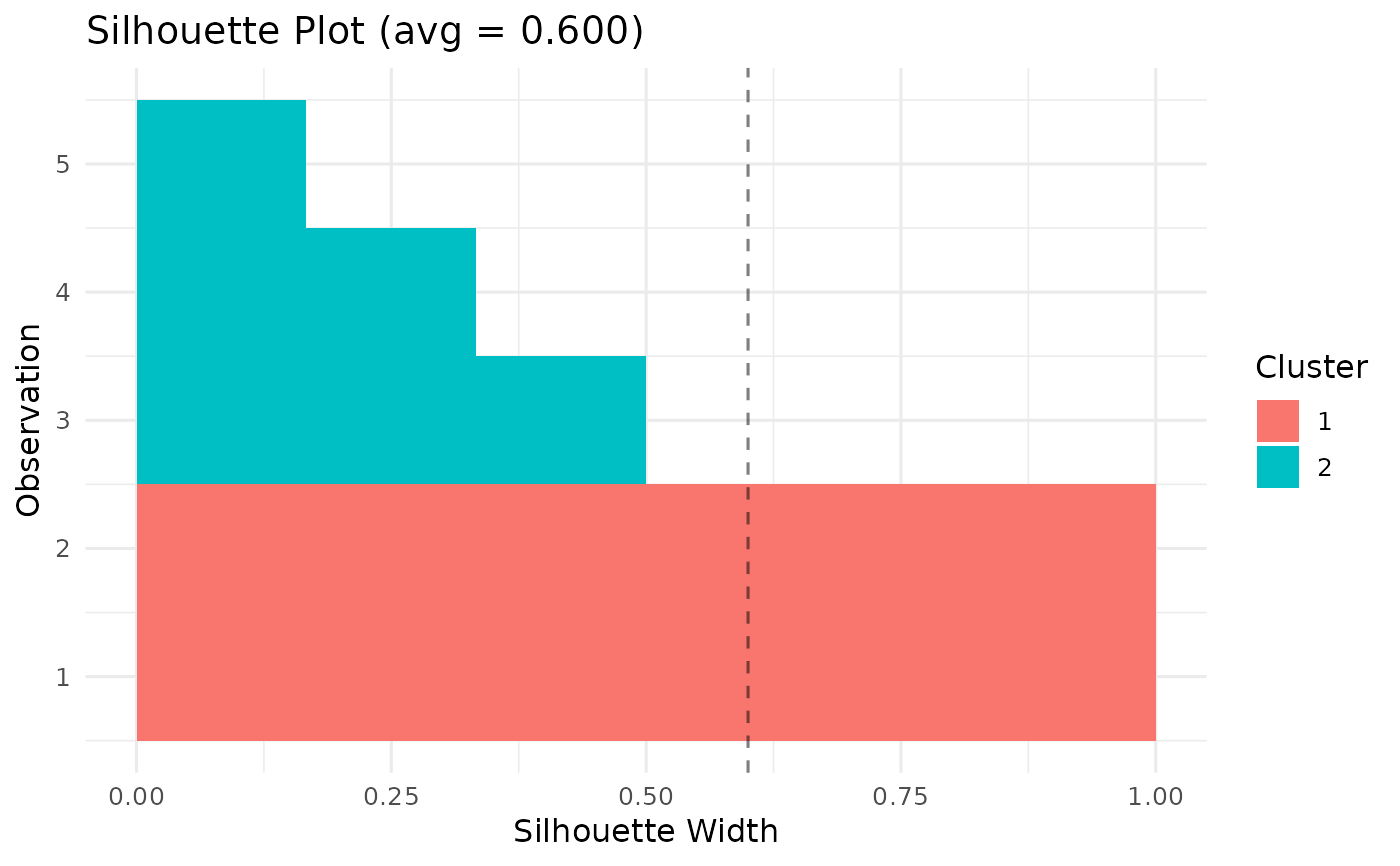
plot(cl, type = "silhouette")
 # \donttest{
set.seed(1)
seqs <- data.frame(
V1 = sample(c("A","B","C"), 20, TRUE),
V2 = sample(c("A","B","C"), 20, TRUE),
V3 = sample(c("A","B","C"), 20, TRUE)
)
cl <- build_clusters(seqs, k = 2)
plot(cl, type = "silhouette")
# \donttest{
set.seed(1)
seqs <- data.frame(
V1 = sample(c("A","B","C"), 20, TRUE),
V2 = sample(c("A","B","C"), 20, TRUE),
V3 = sample(c("A","B","C"), 20, TRUE)
)
cl <- build_clusters(seqs, k = 2)
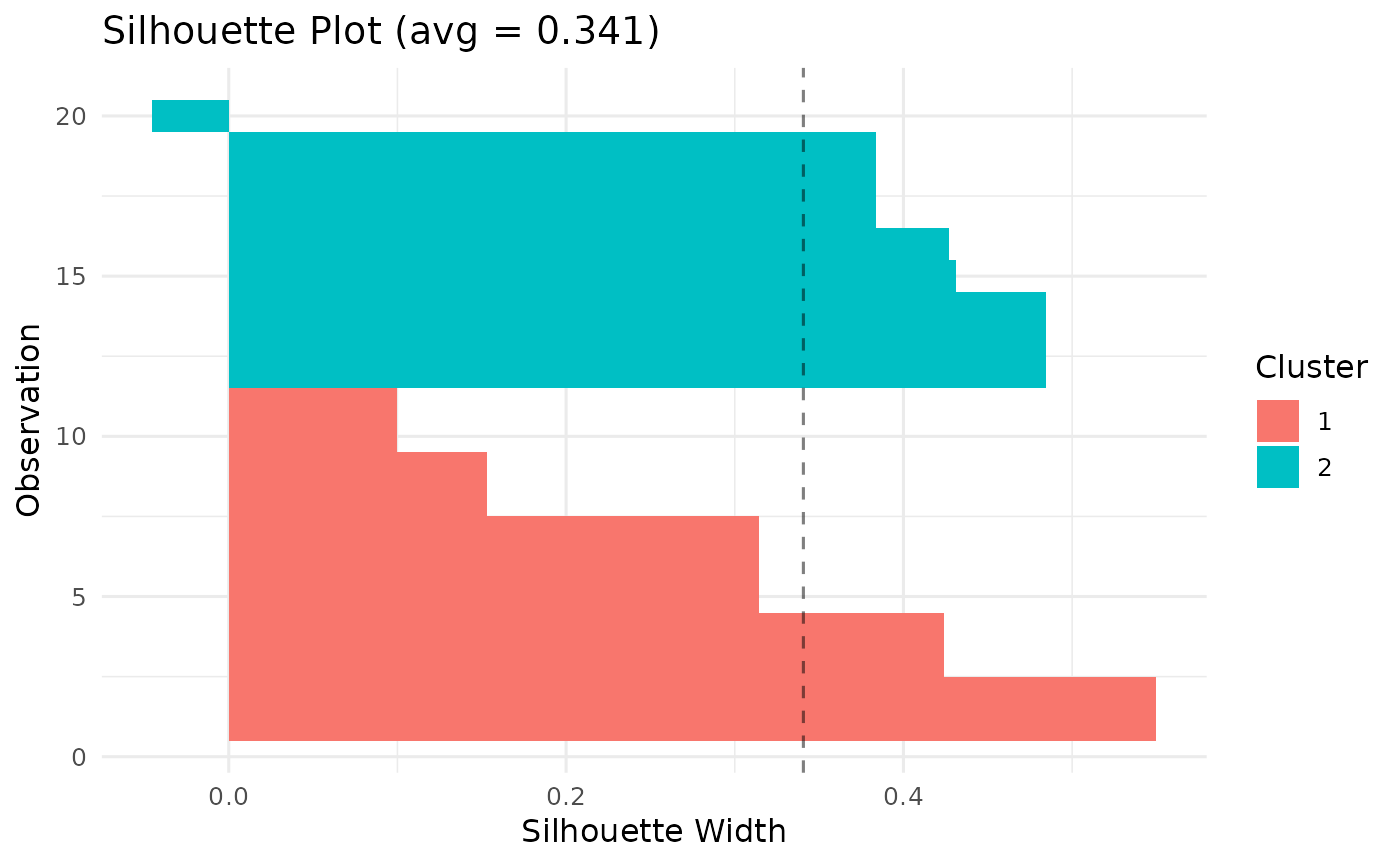
plot(cl, type = "silhouette")
 # }
# }