
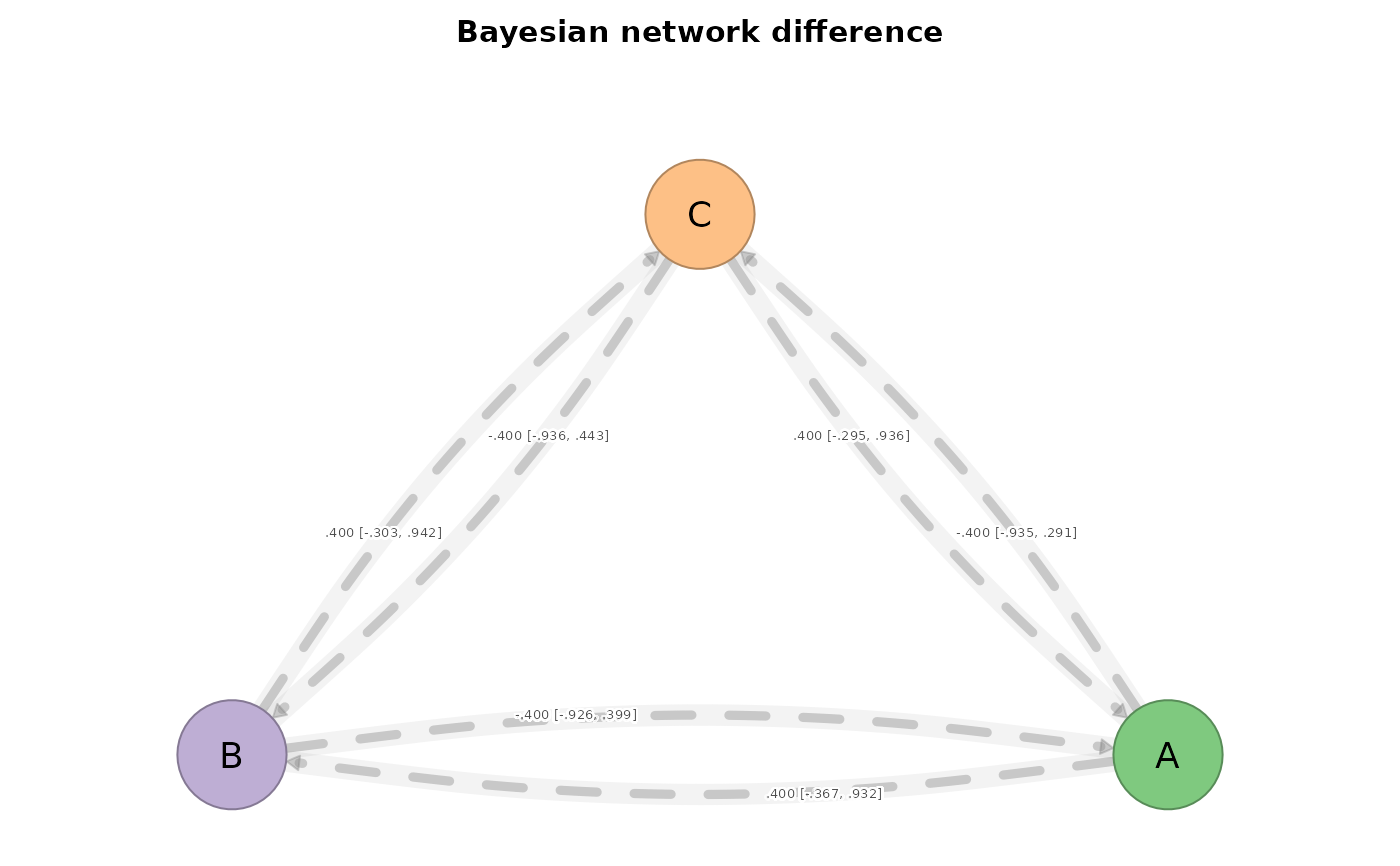
Draws a differential transition network as a directed chord diagram.
Edge colour encodes the signed posterior mean difference (x
stronger vs y stronger) and edge width its magnitude.
Usage
# S3 method for class 'net_bayes'
plot(x, significant_only = TRUE, title = NULL, ...)
Arguments
- x
A
net_bayesobject.- significant_only
Logical. Show only credibly-different edges (default
TRUE).- title
Optional plot title.
- ...
Additional arguments passed to
cograph::splot()when cograph is available.
Value
Invisibly, the cograph network returned by cograph::splot()
when cograph is available; otherwise a fallback ggplot object.
Examples
# \donttest{
s1 <- data.frame(V1 = c("A","B","C"), V2 = c("B","C","A"))
s2 <- data.frame(V1 = c("A","C","B"), V2 = c("C","B","A"))
b <- bayes_compare(build_network(s1, method = "relative"),
build_network(s2, method = "relative"),
draws = 500, seed = 1)
plot(b, significant_only = FALSE)
 # }
# }