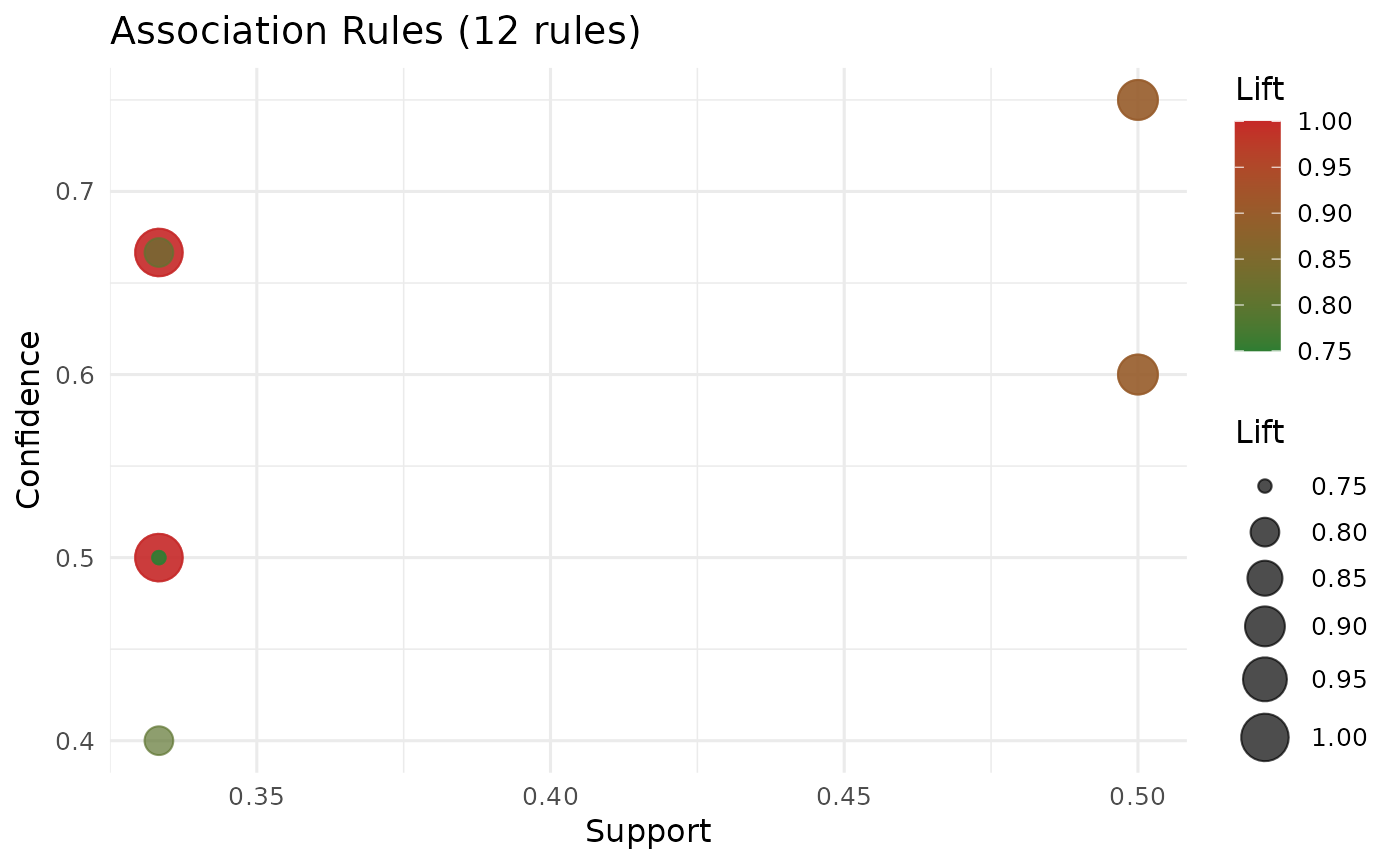
Scatter plot of association rules: support vs confidence, with point size proportional to lift.
Usage
# S3 method for class 'net_association_rules'
plot(x, ...)Scatter plot of association rules: support vs confidence, with point size proportional to lift.
# S3 method for class 'net_association_rules'
plot(x, ...)