
build_honem() places the nodes of a higher-order network (HON) in a
low-dimensional space, after the HONEM approach of Saebi et al. (2020):
nodes whose multi-step transition profiles are alike (where they lead in
one, two or more steps) get nearby coordinates. It reads a net_hon from
build_hon(), whose higher-order nodes (such as "A -> B") are embedded
beside the first-order ones, or any square weighted adjacency matrix. The
coordinates come from a decayed multi-step proximity matrix (see
Details).
The coordinates have no units and the sign of each dimension is
arbitrary; what carries meaning is how close nodes lie to each other.
The variance explained says how much of the proximity matrix the dim
kept dimensions reproduce; a plot of two of them shows less than that.
Arguments
- hon
The network to embed: a
net_honobject frombuild_hon(), or a square weighted adjacency matrix with at least 2 rows. Anything else raises an error.- dim
The number of embedding dimensions. Default
32. It is capped at the number of nodes minus 1 without a warning;print()reports the dimension used.- max_power
\(L\), the highest matrix power in the decayed sum, at least 1. Default
10. Higher values let longer paths shape the proximities.- x
- ...
For the
plot()method: further arguments passed tographics::plot(). For theprint()andsummary()methods: ignored.- object
For the
summary()method: anet_honemobject.- dims
For the
plot()method: the two dimensions to draw. Defaultc(1, 2); a dimension the embedding does not have raises an error. Nodes are labelled when there are at most 50; an embedding with a single dimension draws nothing and says so in a message.
Value
A net_honem object. print() shows the number of nodes, the
dimensions, max_power and the variance explained; summary() prints
the leading singular values and the range of the coordinates, and
returns one row per node; plot() draws the nodes on two dimensions.
The object's fields:
- embeddings
Numeric matrix (nodes x
dim) of coordinates, with the node names as row names and columnsdim_1,dim_2, ...- nodes
Character vector of node names.
- singular_values
The
dimleading singular values.- explained_variance
Share of the squared singular values held by the kept dimensions.
- dim
Embedding dimension used.
- max_power
Highest matrix power used.
- n_nodes
Number of nodes embedded.
The print() and plot() methods return the input invisibly.
summary() returns a data frame with one row per node: node (the node
name), then dim1, dim2, ... with the coordinates; the summary text is
printed as a side effect.
Details
No random walks or skip-gram are used: the coordinates come from the
truncated singular value decomposition of the proximity matrix. With
\(D\) the row-normalised transition matrix over all HON nodes (rows
without outgoing edges stay zero), the proximity matrix is
\(S = Z^{-1} \sum_{k=0}^{L} e^{-k} D^{k+1}\) with
\(Z = \sum_{k=0}^{L} e^{-k}\) and \(L\) = max_power, where
\(D^{k+1}\) is a matrix power. Each node's embedding is its row of
\(U_d \sqrt{\Sigma_d}\), from the first \(d\) = dim singular
vectors and values of \(S\). explained_variance is the share of the
sum of squared singular values held by the first \(d\); \(S\) is not
centred, so this is not a principal-component variance.
How this differs from the paper. Saebi et al. write the same sum, but there \(D^v\) is a v-th-order neighbourhood matrix over first-order nodes (the superscript is an order, not a power), filled from the HON edge weights of order-v dependencies, with \(L\) the highest order present, rule extraction changed to keep every lower order, and one embedding per first-order node. The paper gives no formula for \(D^v\), and its worked example (Supplementary Table S.1) is internally inconsistent; no reference code is public. This function therefore does not claim to reproduce the paper's embeddings.
References
Saebi, M., Ciampaglia, G. L., Kaplan, L. M., & Chawla, N. V. (2020). HONEM: Learning Embedding for Higher Order Networks. Big Data, 8(4), 255-269.
Examples
seqs <- list(c("A","B","C","D"), c("A","B","C","A"), c("B","C","D","A"))
hem <- build_honem(build_hon(seqs, max_order = 2), dim = 2)
# \donttest{
trajs <- list(c("A","B","C","D"), c("A","B","D","C"),
c("B","C","D","A"), c("C","D","A","B"))
hon <- build_hon(trajs, max_order = 2)
emb <- build_honem(hon, dim = 4)
print(emb)
#> HONEM: Higher-Order Network Embedding
#> Nodes: 4
#> Dimensions: 3
#> Max power: 10
#> Variance explained: 94.6%
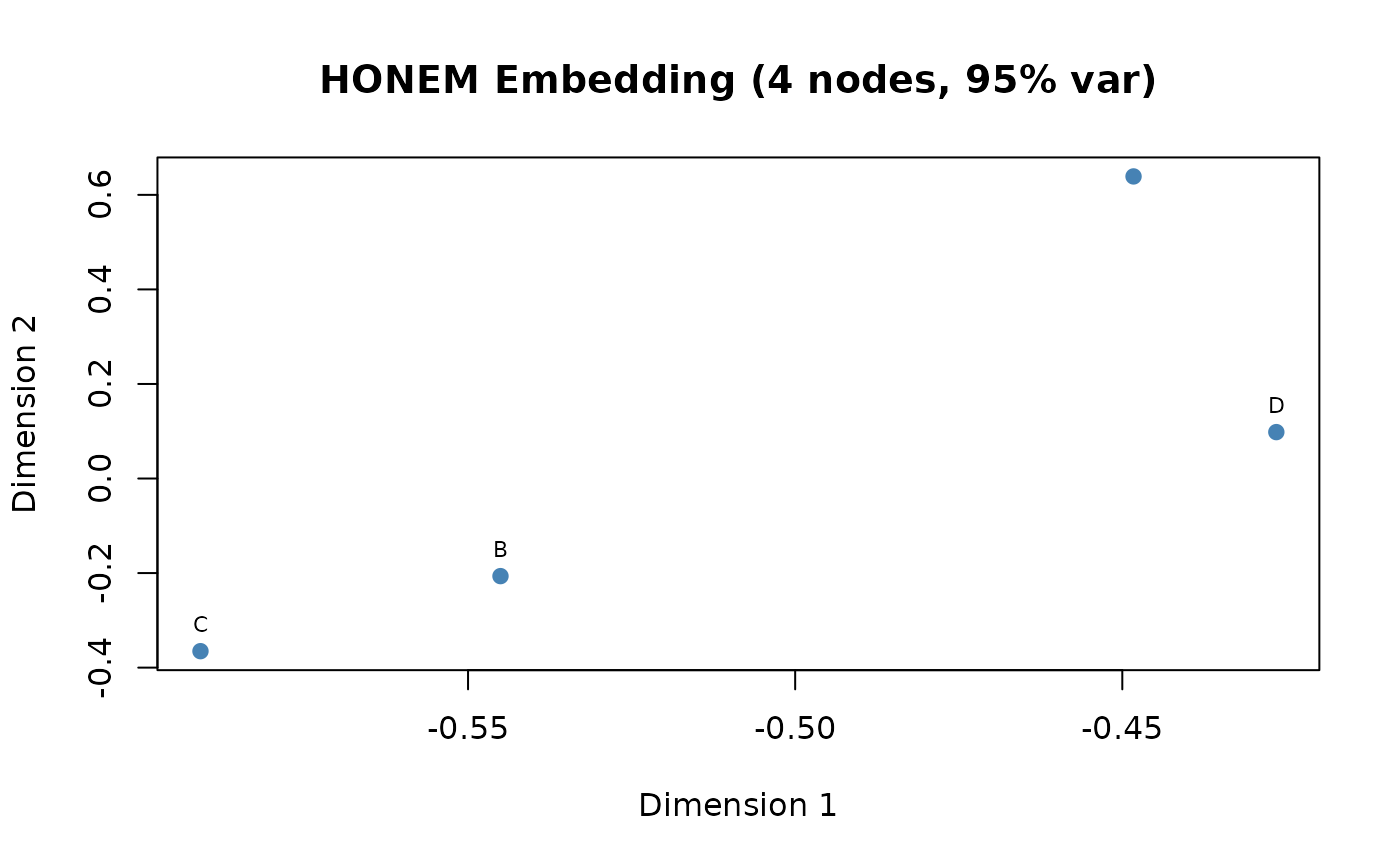
plot(emb)
 # }