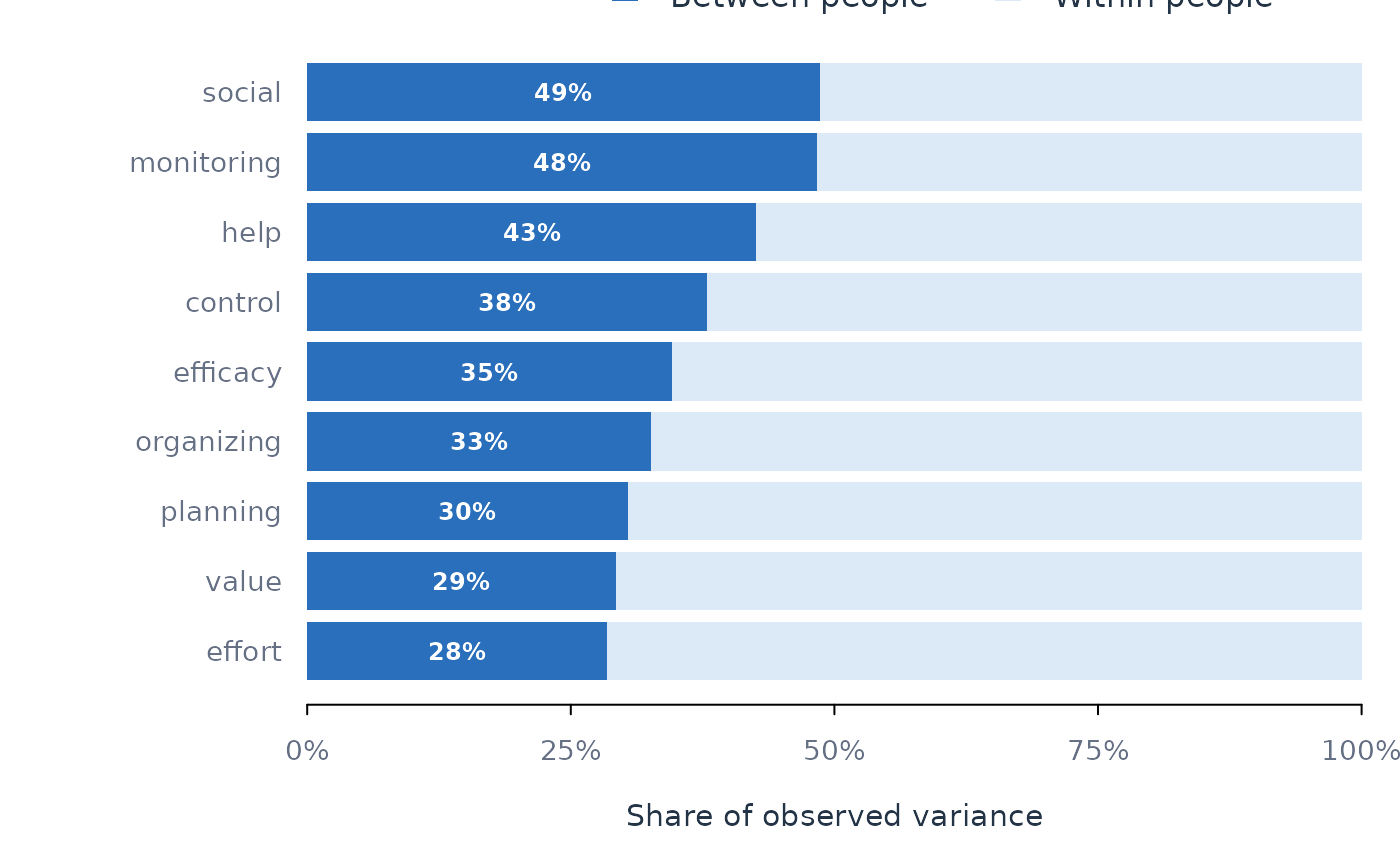
One bar per variable, split into the share of variance lying within people and between people. Variables at the top are the ones where people differ in level; variables at the bottom are the ones that move within a person.
Arguments
- x
A
variance_components()result.- sort_by
Sort bars by this column;
NULLkeeps input order.- ...
Passed to base plotting functions.
Examples
v <- variance_components(srl, vars = "efficacy:organizing", id = "name")
plot_variance(v)