Skip to contents

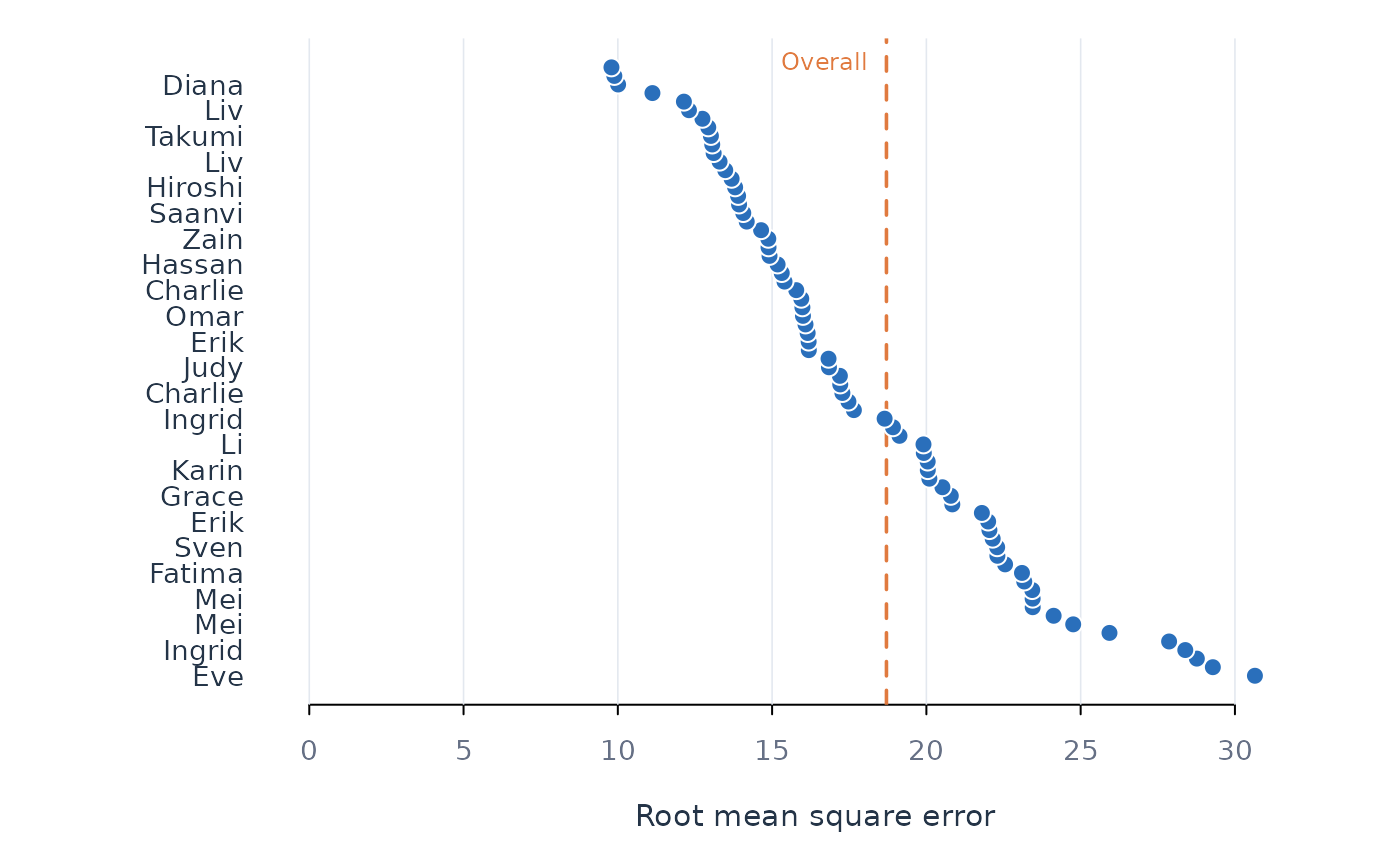
Sorted bars, one per person, with the aggregate drawn as a reference line. The people whose bars sit the wrong side of that line are the ones the model is failing – which is the question idiographic work exists to ask.

Usage

plot_subjects(x, metric = NULL, model = NULL, scope = NULL, n = NULL, ...)

Arguments

x

An idiographic fit.

metric

Metric column. Defaults to rmse, or accuracy when the outcome is a class.

model, scope

Optional filters.

n

Maximum number of people to draw.

...

Passed to base plotting functions.

Value

Invisibly, the plotted table.

Examples

fit <- fit_ml(srl, y = "effort", x = "efficacy:monitoring", id = "name",
              time = "day", model = "ridge")
plot_subjects(fit)