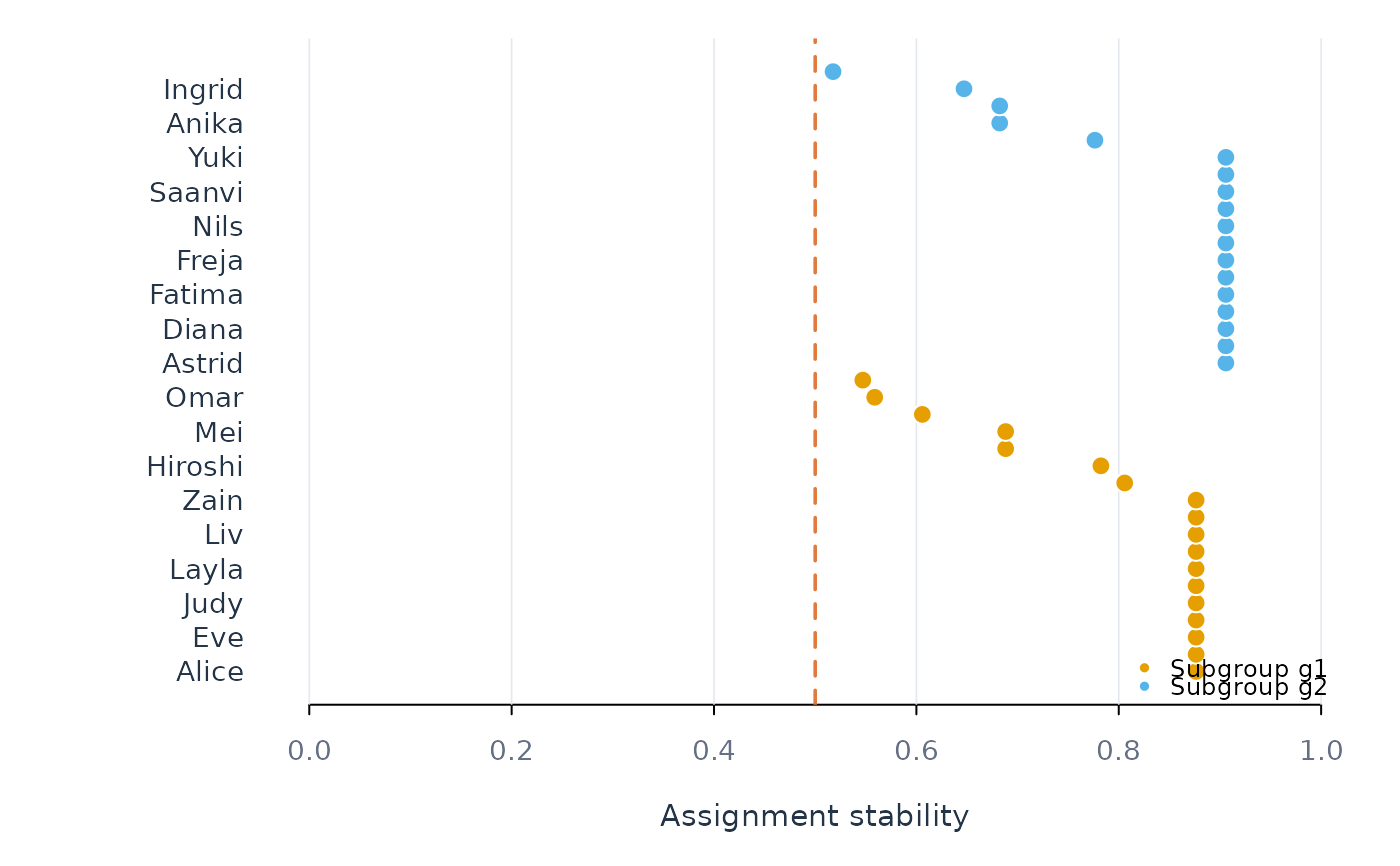
For a find_subgroups() result, the stability of each person, grouped by
subgroup, with the chance level drawn in: bars near that line are people the
method could not place. For a fit with subgroups, the metric per subgroup.
Arguments
- x
An
find_subgroups()result or a fit built with subgroups.- metric
Metric column, when
xis a fit.- ...
Passed to base plotting functions.
Examples
g <- find_subgroups(srl, y = "effort", x = "efficacy:monitoring",
                    id = "name", k = 2, reps = 10)
plot_subgroups(g)