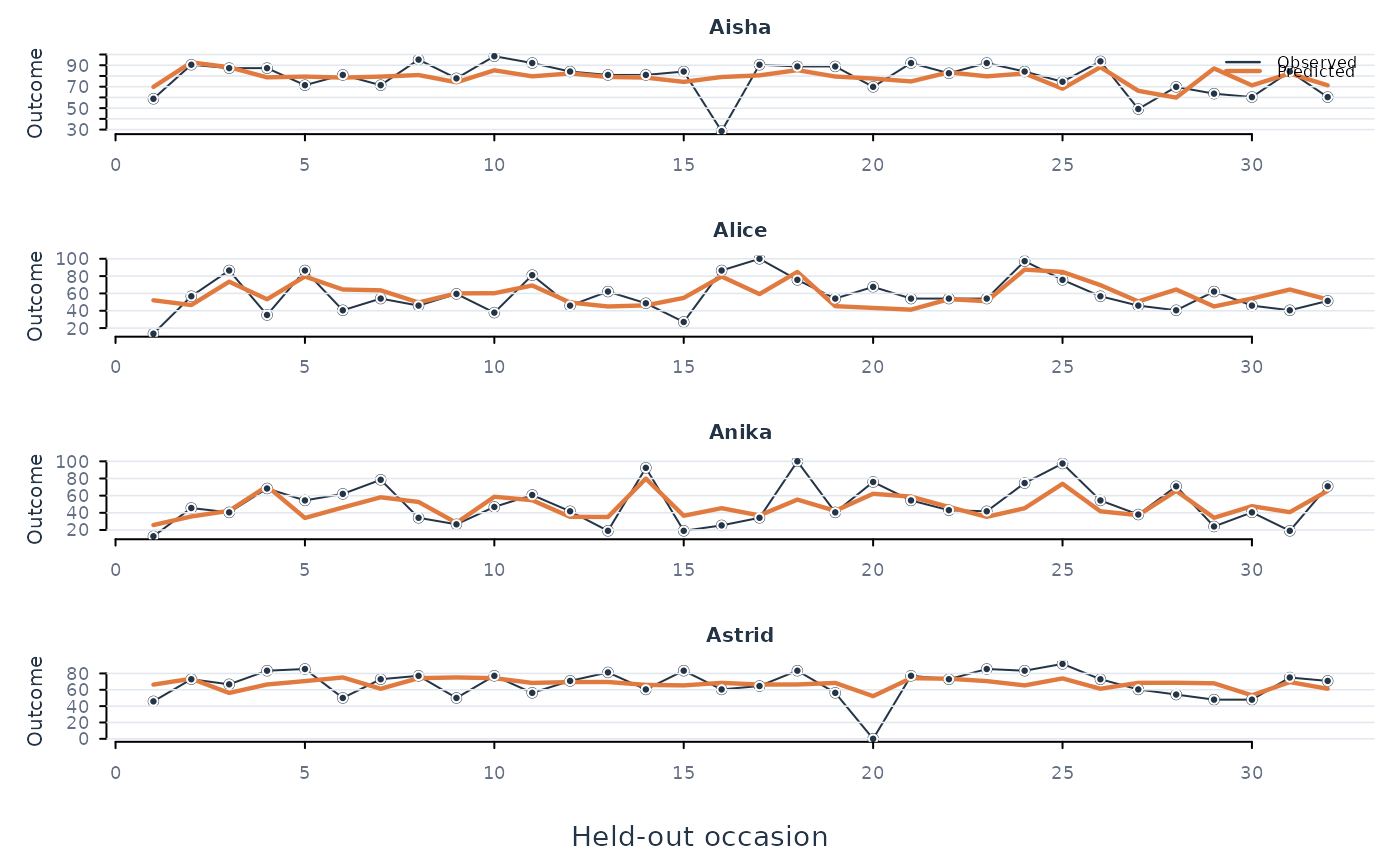
One panel per person: what actually happened, and what the model said would happen, over the held-out occasions. This is the plot that shows whether a model tracks a person, which a scatter of everyone pooled together hides.
Examples
fit <- fit_ml(srl, y = "effort", x = "efficacy:monitoring", id = "name",
              time = "day", model = "ridge", scope = "individual")
plot_predictions(fit, n_subjects = 4)