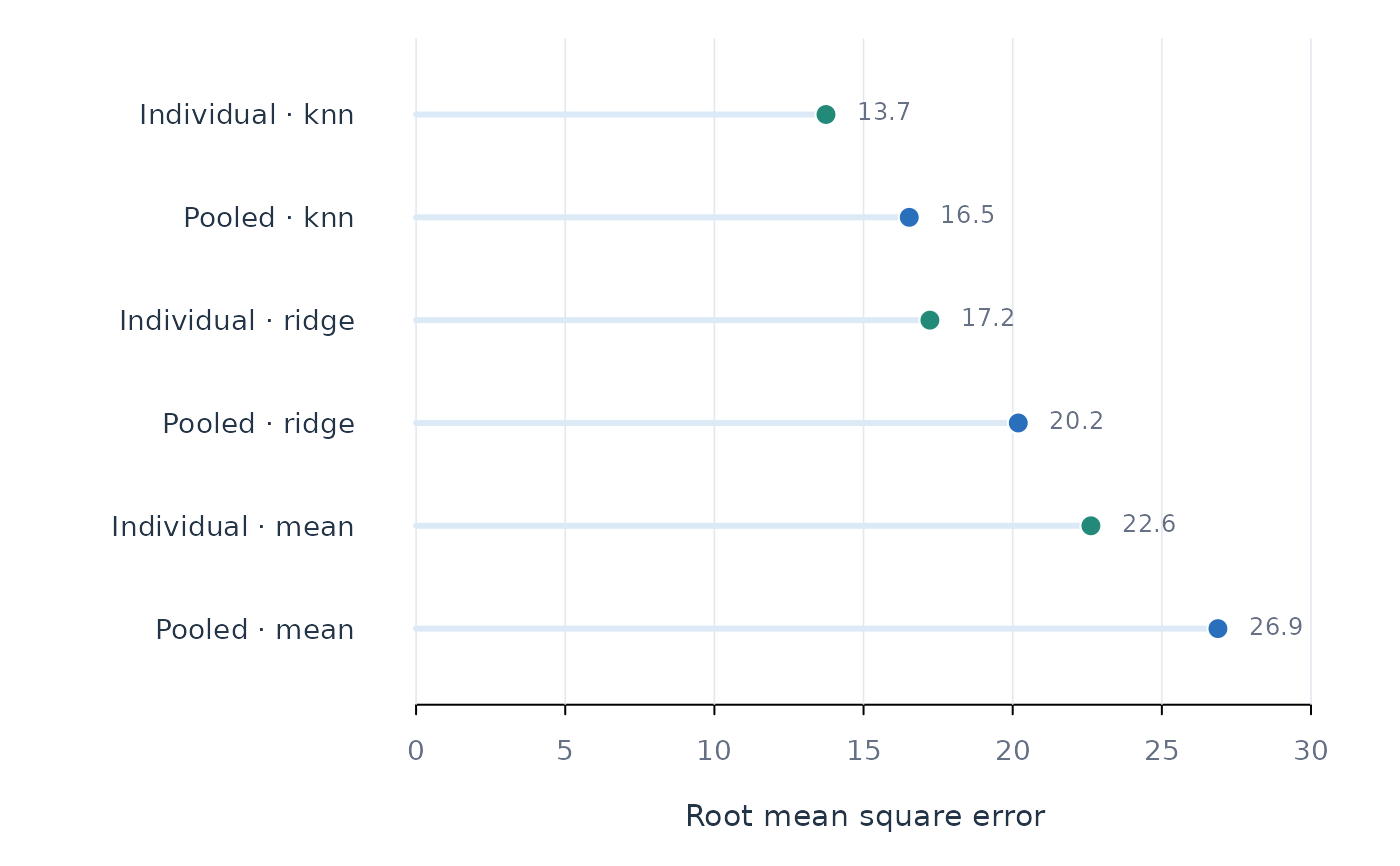
Bars for one metric, one bar per model and scope. Defaults to the .overall
rows, which is the comparison people usually want: pooled versus subgroup
versus individual.
Usage
plot_metrics(x, metric = NULL, model = NULL, scope = NULL, overall = TRUE, ...)
Arguments
- x
An idiographic fit.
- metric
Metric column to plot. Defaults to rmse for regression and
accuracy for classification.
- model, scope
Optional filters.
- overall
Logical. Plot the aggregate rows (default) or every subject.
- ...
Passed to base plotting functions.
Value
Invisibly, the plotted table.
Examples
fit <- fit_ml(srl, y = "effort", x = "efficacy:monitoring", id = "name",
              time = "day", model = c("mean", "ridge", "knn"))
plot_metrics(fit)