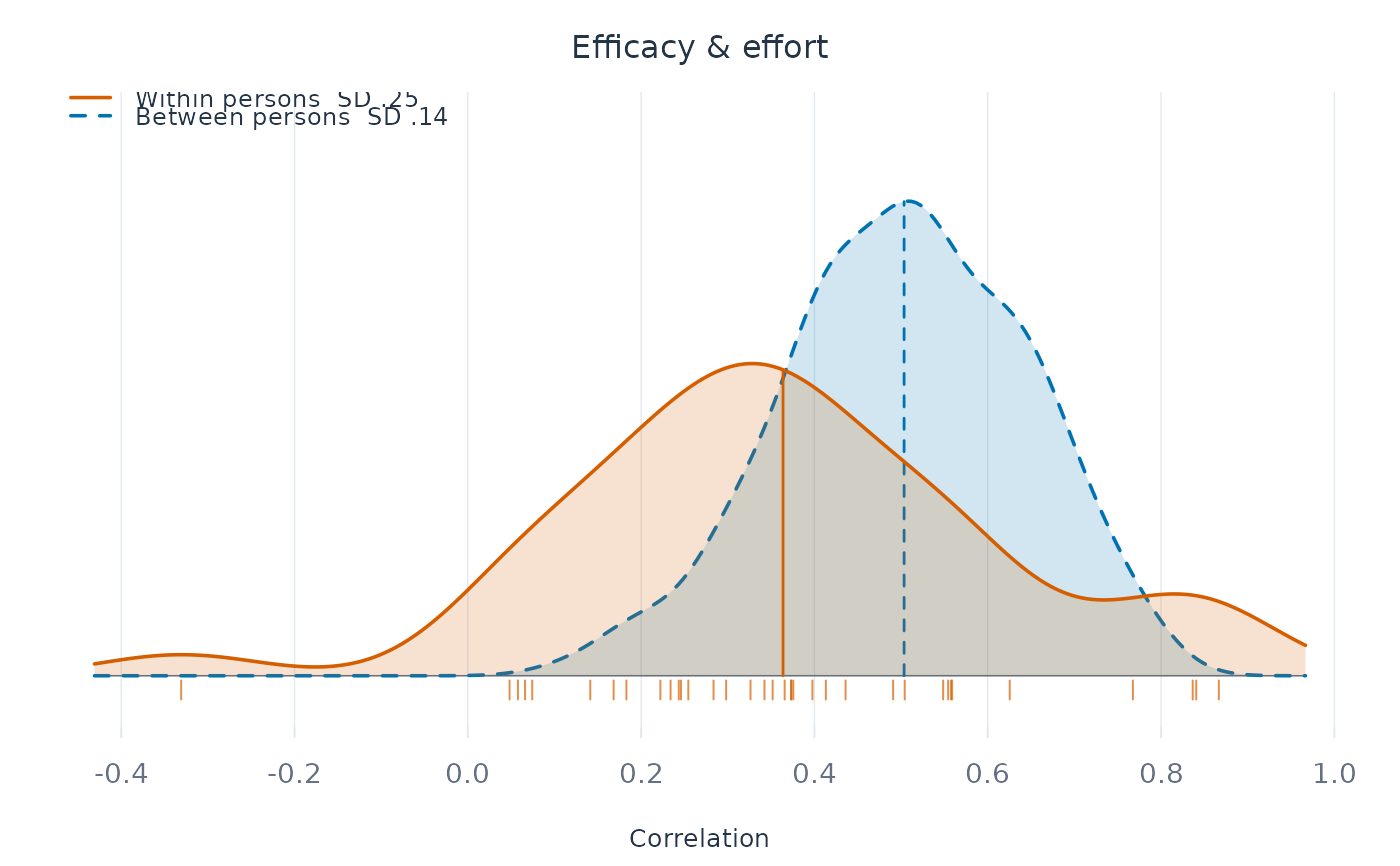
Plot within-person against between-person correlations
Source:R/stats_correlate_levels.R
plot_levels.RdOne panel per pair of variables, after Fisher, Medaglia and Jeronimus (2018). Each panel shows the distribution of within-person correlations (one per person) and of between-person correlations (one per occasion) as kernel density curves, so that distributions based on different numbers of correlations share one scale. Ticks along the baseline mark the individual within-person correlations and a vertical stem marks each mean. The two levels differ in line type (within solid, between dashed) as well as in colour, and the key reports the standard deviation of each distribution.
Arguments
- x
A
correlate_levels()result.- x_var, y_var
Optional: plot only pairs involving these variables.
- ...
Ignored.
Examples
lv <- correlate_levels(srl, id = "name", vars = c("efficacy", "effort"),
                       time = "day")
plot_levels(lv)