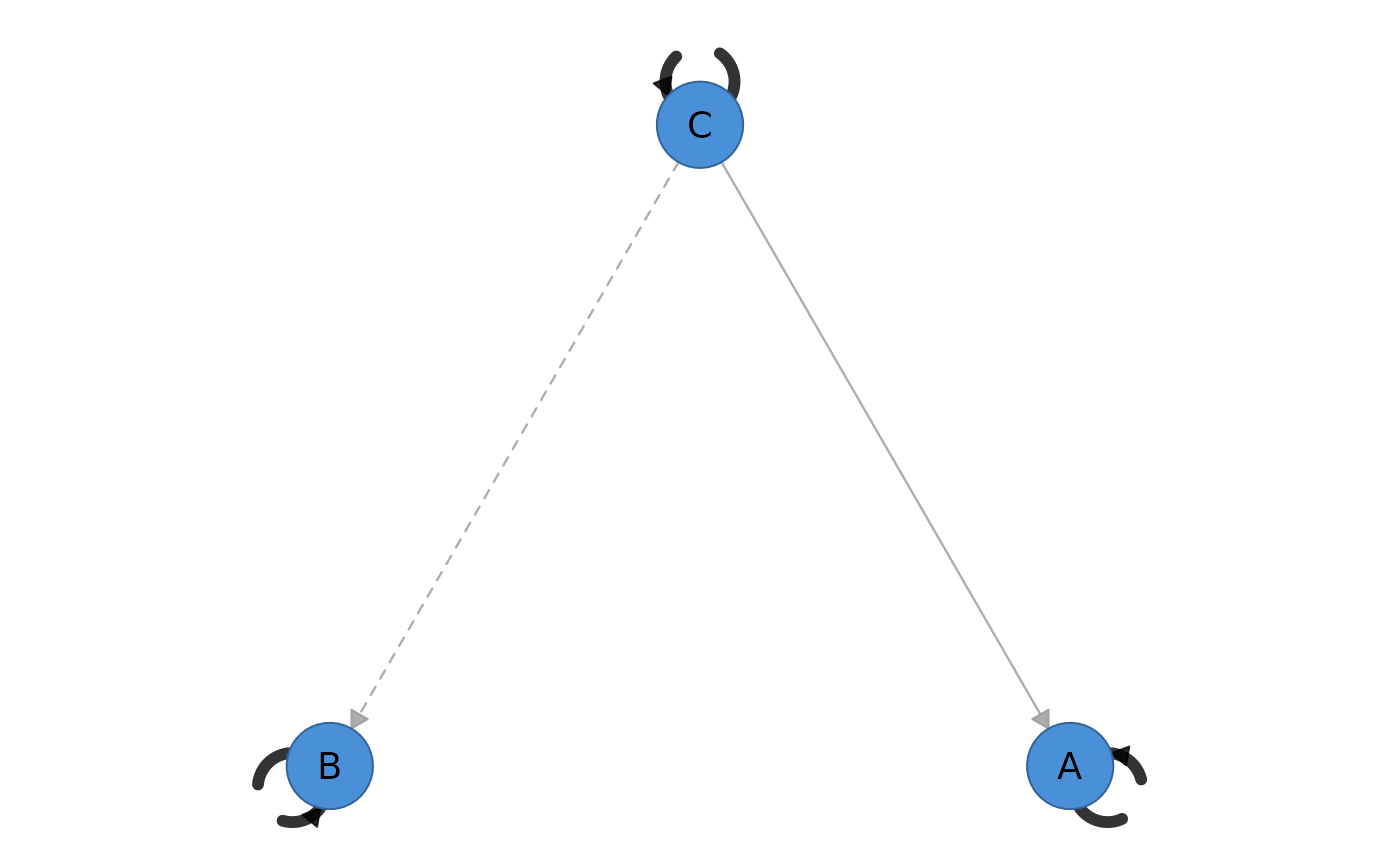
Faithful GIMME network plot (the gimme-package convention, via cograph)
Source: R/vendored.R
plot_gimme.RdDraws a GIMME result the way the gimme package does: a single p-node
network where dashed edges are lag-1 (temporal) and solid
edges are lag-0 (contemporaneous), edge width is the proportion of
subjects that have the path, black edges are group-level paths and
grey edges individual-level, and autoregression shows as a dashed self-loop.
Rendered with cograph::splot(), so a lag and a contemporaneous effect
between the same pair are drawn as two parallel edges.
Usage
plot_gimme(
  x,
  weight = c("prop", "coef"),
  group_color = "black",
  individual_color = "grey60",
  layout = "circle",
  curvature = 0.25,
  edge_scale = 5,
  ...
)
Arguments
- x
A
net_gimmeobject fromfit_gimme().- weight
"prop"(default, proportion of subjects) or"coef"(group-average standardized coefficient) for edge width.- group_color, individual_color
Edge colours for group- vs individual-level paths. Defaults
"black"/"grey60".- layout
cograph layout passed to
cograph::splot(). Default"circle", matching gimme.- curvature
Edge curvature (separates parallel lag/contemp edges). Default
0.25.- edge_scale
Multiplier mapping weight to drawn line width. Default
5.- ...
Further arguments forwarded to
cograph::splot().
See also
as_netobject() for the matrix view.