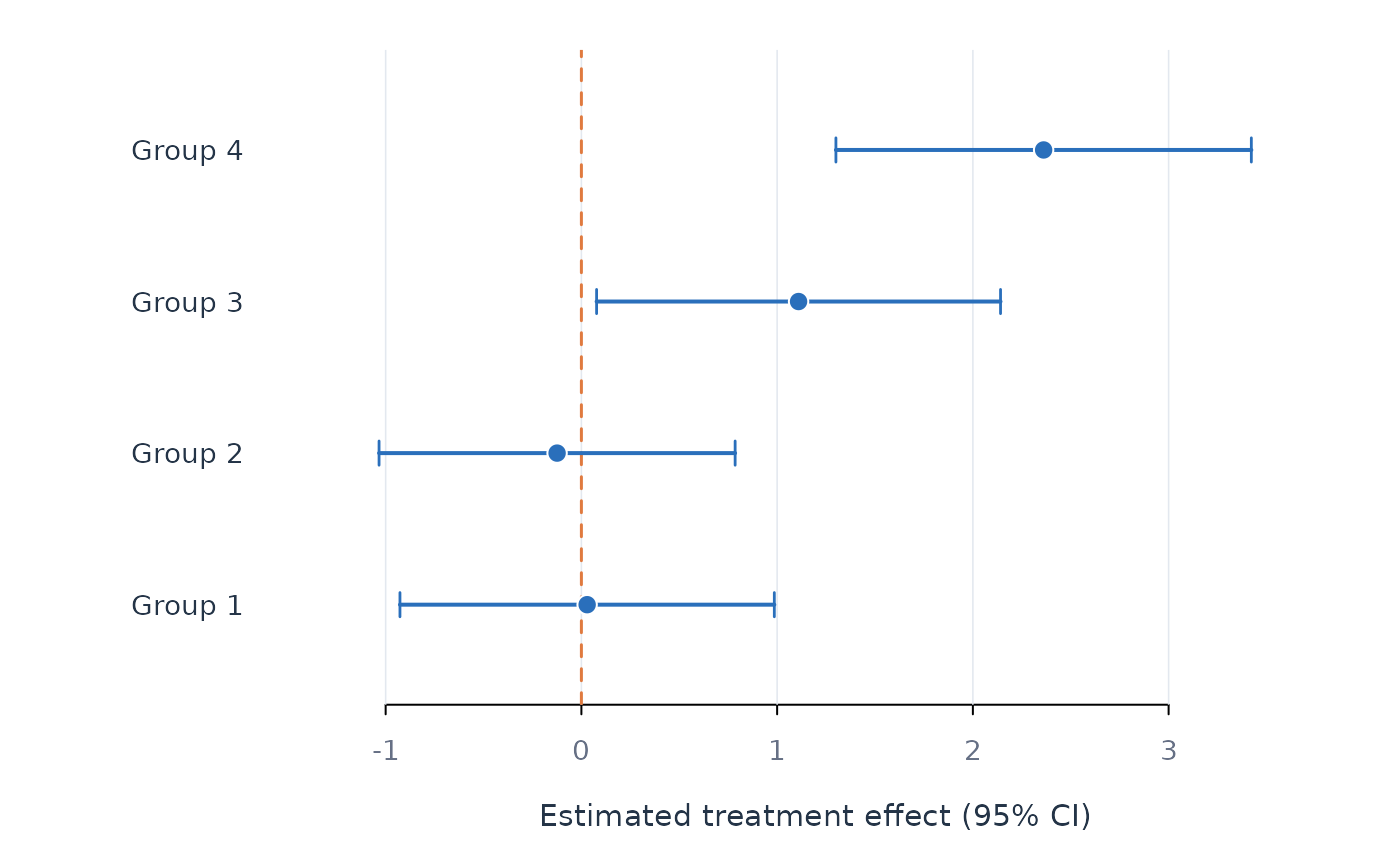
Draws the GATES groups with their confidence intervals: a rising staircase whose ends do not overlap is heterogeneity you can act on.
Arguments
- x
An
fit_effects()result.- scope, subject, subgroup
Optional filters.
- contrast
Which contrast to draw, when the treatment has several arms. Defaults to the first.
- ...
Passed to base plotting functions.
Examples
set.seed(1)
d <- data.frame(id = rep(1:6, each = 40), day = rep(1:40, 6),
                x1 = rnorm(240), x2 = rnorm(240))
d$drug <- rbinom(240, 1, 0.5)
d$mood <- 2 * d$drug * (d$x1 > 0) + 0.5 * d$x1 + rnorm(240, sd = 0.5)
fit <- fit_effects(d, "mood", "drug", c("x1", "x2"), "id", scope = "pooled")
plot_effects(fit)