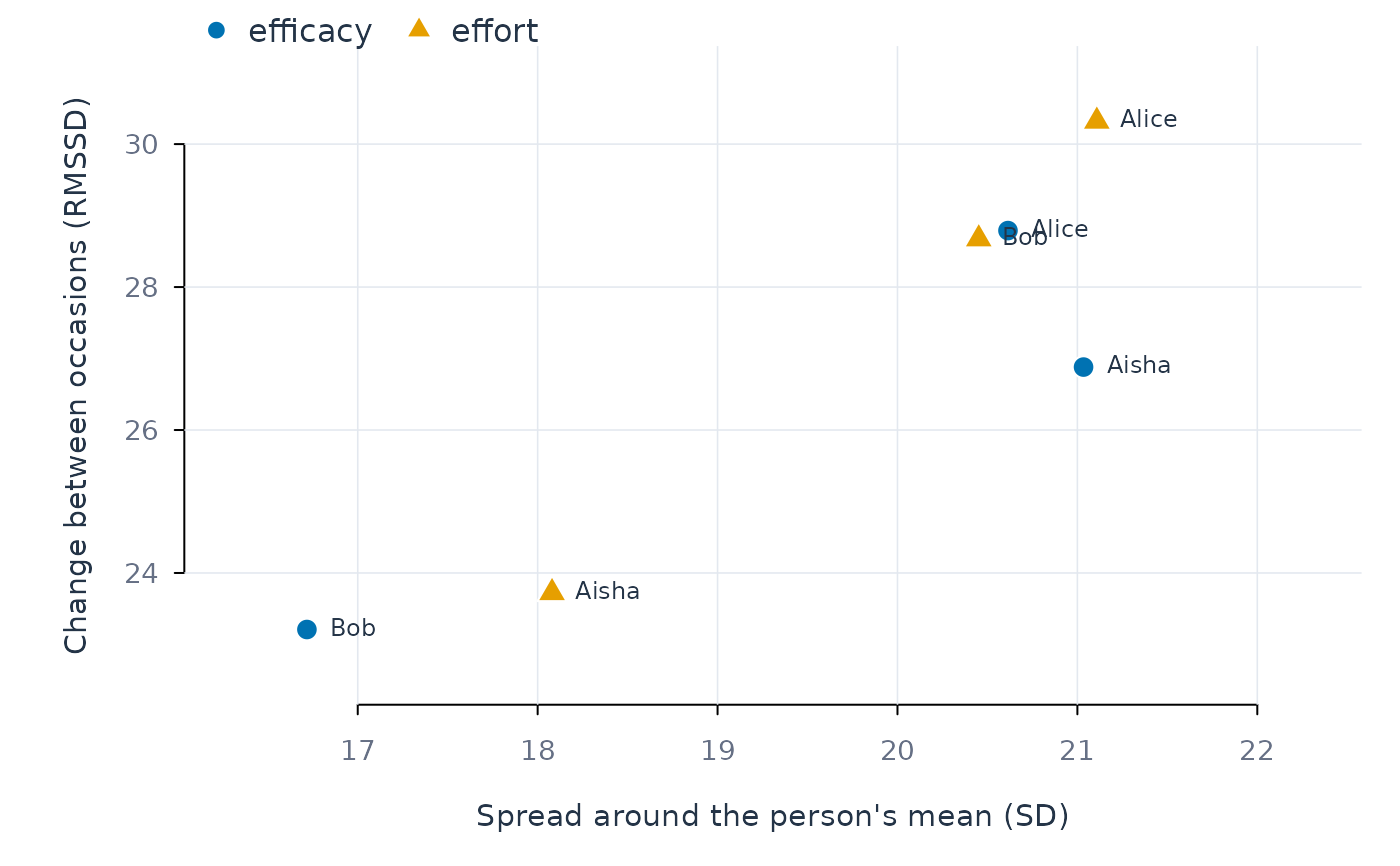
Plot person-level spread against day-to-day change
Source:R/stats_plot_describe.R
plot_descriptives.RdOne point per person and variable. The horizontal axis is how widely a person's values spread around their own mean (standard deviation); the vertical axis is how much they change from one occasion to the next (RMSSD). A point high on the vertical axis belongs to someone whose values jump around; a point far right but low belongs to someone who drifts slowly across a wide range. Variables are told apart by both colour and point shape, and each point is labelled with the person when there are few enough points to read.
Usage
plot_descriptives(
  x,
  stat_x = "sd",
  stat_y = "rmssd",
  subject = NULL,
  variable = NULL,
  label = NULL,
  ...
)
Arguments
- x
A
describe_persons()result.- stat_x, stat_y
Columns of the result to put on each axis.
- subject, variable
Optional filters: only these people or variables.
- label
Label points with the person's name.
NULL(default) labels when at most 30 points are drawn.- ...
Passed to
graphics::plot().
Examples
d <- describe_persons(srl, id = "name", vars = c("efficacy", "effort"),
                      time = "day")
plot_descriptives(d, subject = c("Aisha", "Alice", "Bob"))