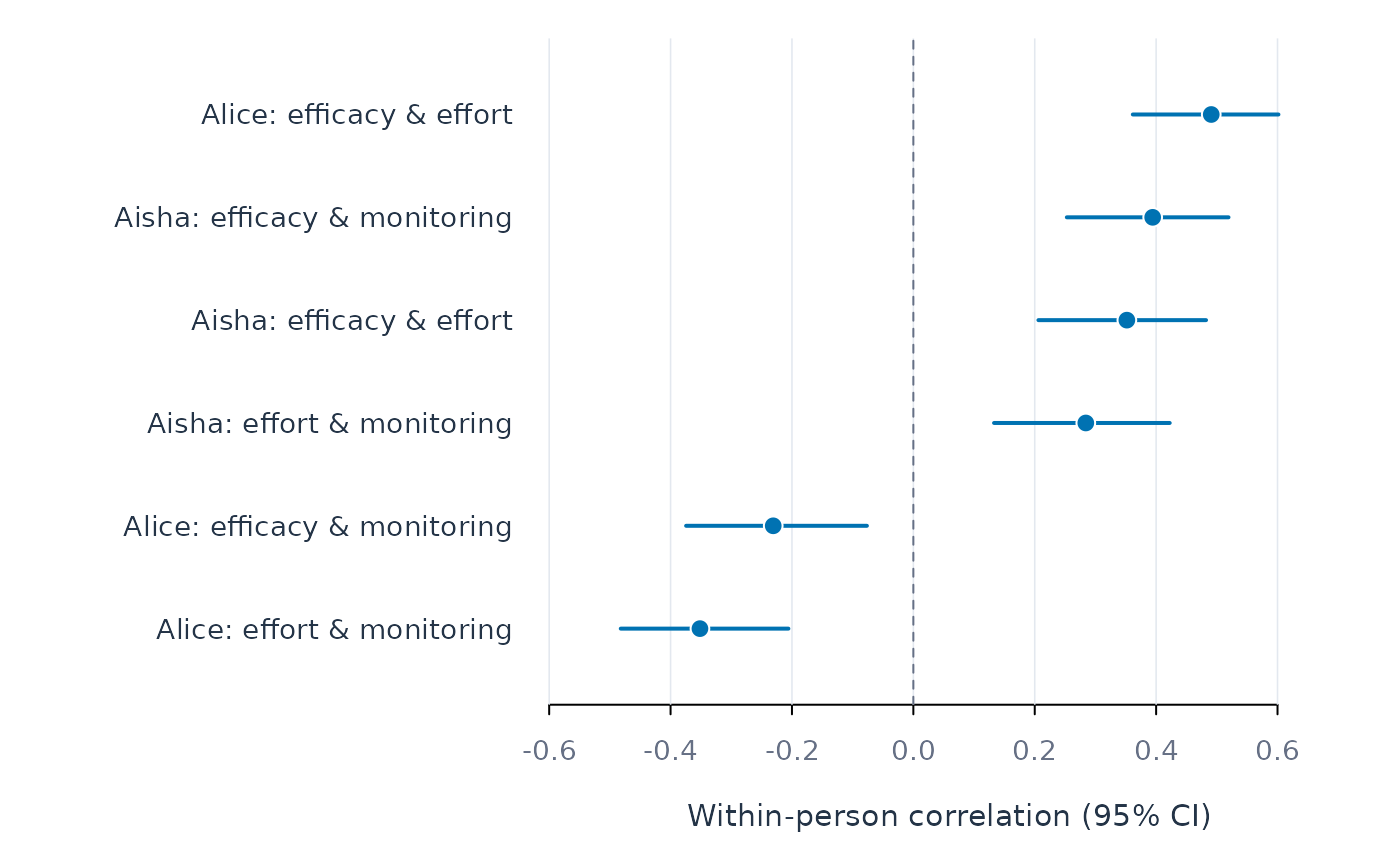
Plot within-person correlations with their confidence intervals
Source:R/stats_plot_describe.R
plot_correlations.RdOne row per person and variable pair, showing the correlation and its 95% confidence interval. Rows are sorted so the strongest positive correlations are at the top. An interval that crosses the dashed zero line means the data cannot tell whether the two variables move together or in opposite directions for that person.
Arguments
- x
A
correlate_persons()result.- subject
Optional filter: only these people.
- sort_by
Column to sort rows by;
NULLkeeps the result's order.- ...
Ignored.
Examples
r <- correlate_persons(srl, id = "name",
                       vars = c("efficacy", "effort", "monitoring"))
plot_correlations(r, subject = c("Aisha", "Alice"))