Plot within-person against between-person effects
Source:R/stats_within_between.R
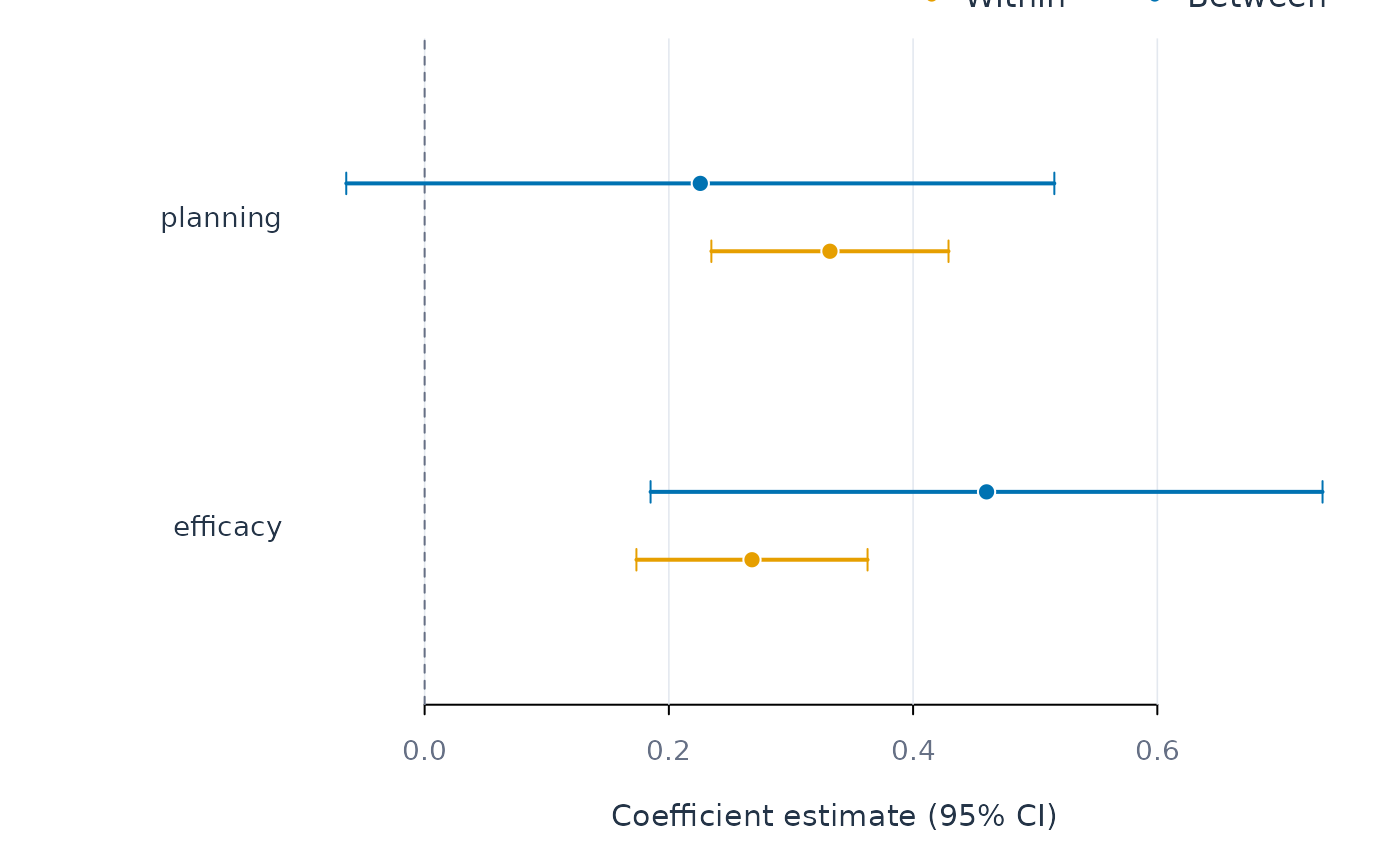
plot_components.RdOne row per predictor, with the within and between coefficients and their confidence intervals. A predictor whose two intervals do not overlap is one where pooling the two processes into a single coefficient would mislead.
Arguments
- x
A
fit_within_between()result.- scope, subject, subgroup
Optional filters.
- ...
Passed to base plotting functions.
Examples
fit <- fit_within_between(srl, y = "effort", x = c("efficacy", "planning"),
                          id = "name", time = "day")
plot_components(fit)