Plot memory-network communities
Source:R/memory_communities.R
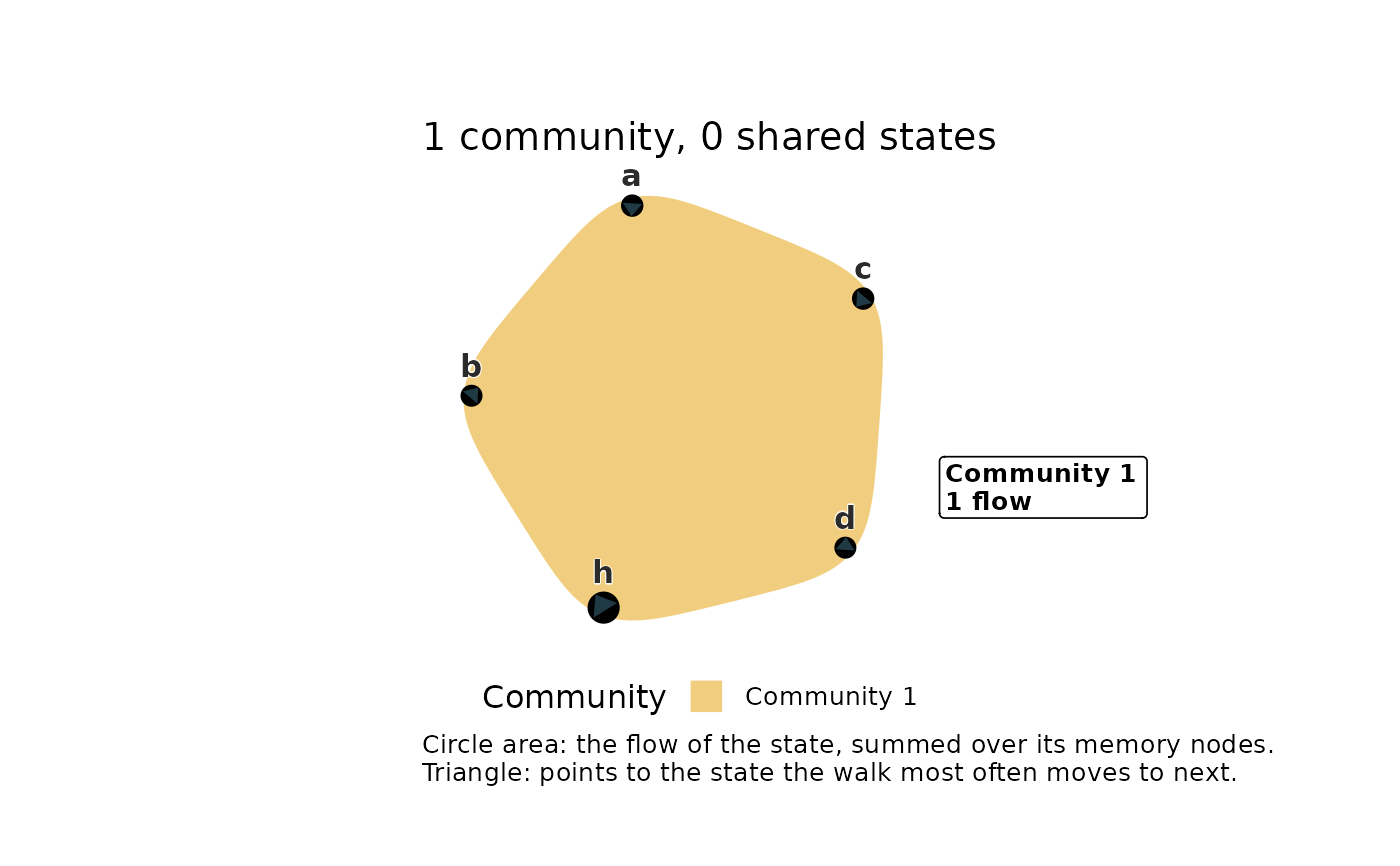
plot.hypergraphs_memory_communities.Rdtype = "physical"(default)every community as a pebble around the states it holds, through
plot.net_hg()on the community hypergraph. A state shared by several communities lies inside each of their pebbles. Every state is a circle whose area follows its flow, with a triangle pointing at the state the walk most often moves to next, and every community has a title box with its flow.type = "network"the network of states as a transition network analysis plot through
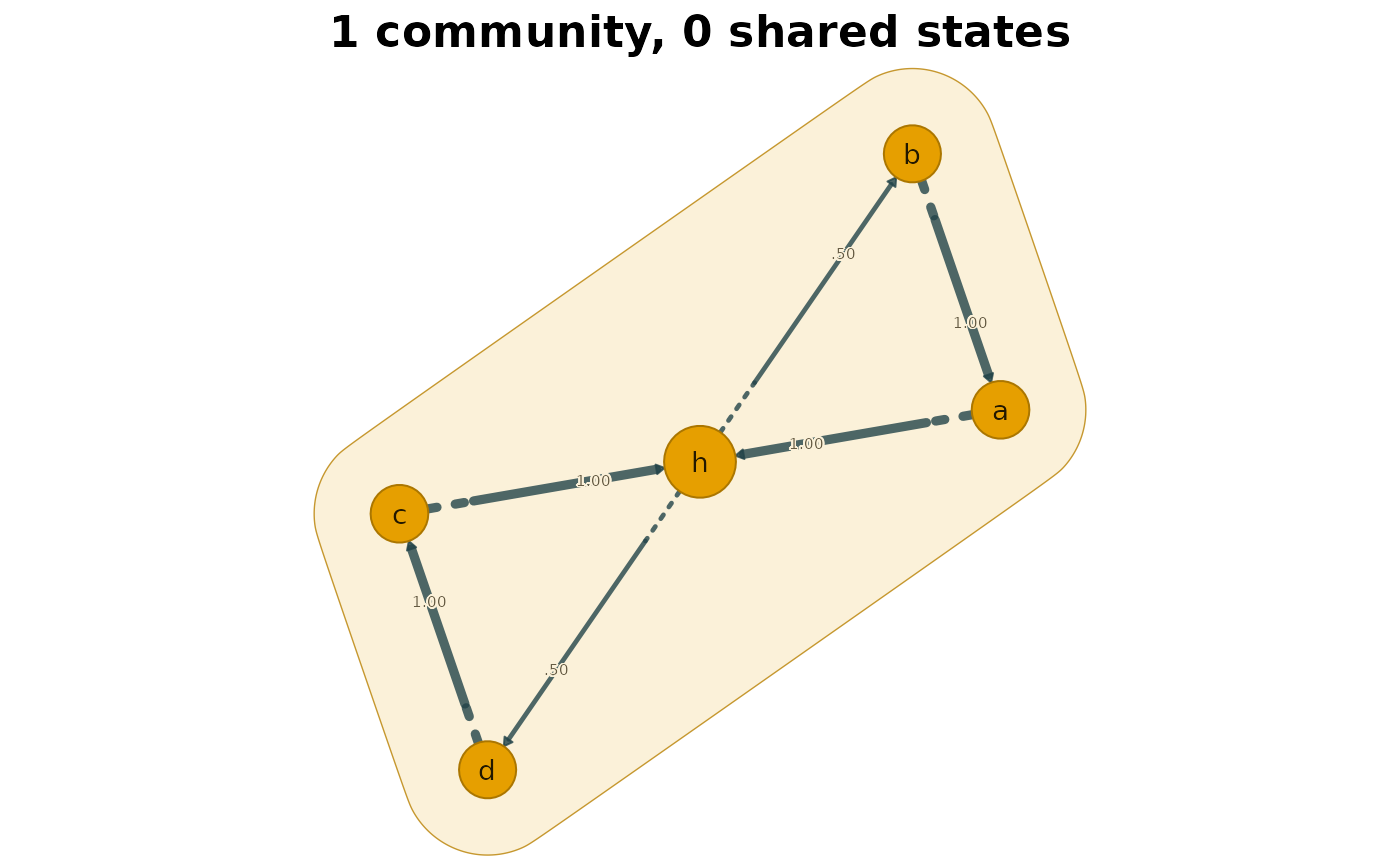
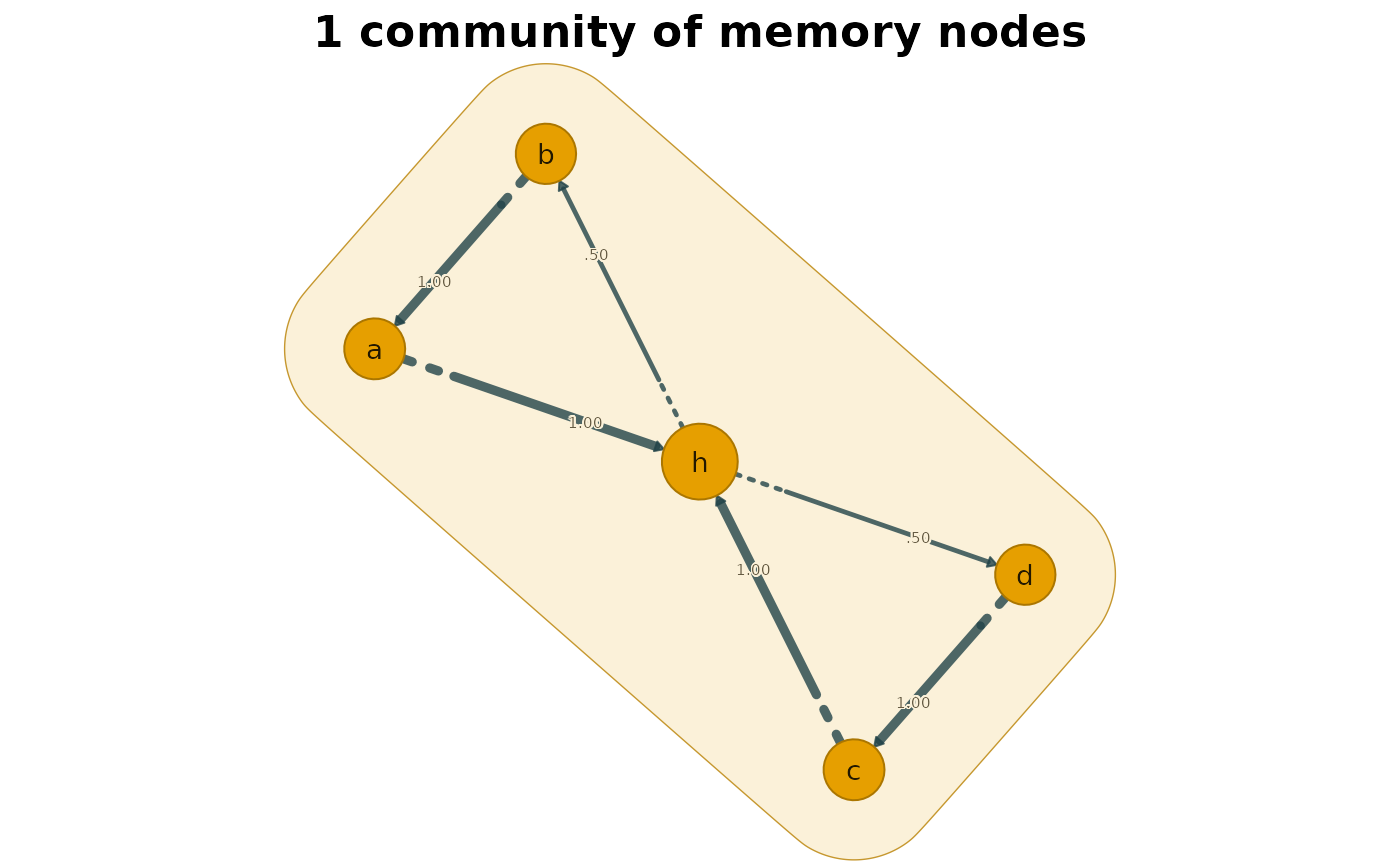
cograph::overlay_communities(): every arrow is a transition with its probability (transitions below 0.05 hidden), every state a circle whose area follows its flow, coloured (Okabe-Ito) by the community that holds most of its flow, and every community a blob around its states, so a shared state lies in two blobs.type = "states"the network of memory nodes drawn in the same way, laid out by the walk's transitions between them so that the nodes of a community sit together. Memory nodes with no flow are left out unless
show_zero_flow = TRUE, and the title says how many. With more than 20 nodes the probabilities are not printed on the arrows.
Memory nodes with no flow (reached only by random jumps, see
hg_communities()) carry no flow of their states and are never drawn in
the physical view. The tables returned by
hg_get.hypergraphs_memory_communities() are unaffected.
Arguments
- x
A
hypergraphs_memory_communitiesobject.- type
"physical"(default),"network"or"states".- show_zero_flow
Draw the memory nodes with no flow in the
type = "states"view? DefaultFALSE.- ...
For
"physical", passed toplot.net_hg()(e.g.seed,label_size,arrow_style = "outside",layout); for"network"and"states", passed tocograph::overlay_communities()and on tocograph::splot()(e.g.layout,edge_label_style,threshold,blob_alpha). They override the defaults set here.
Value
For "physical", a ggplot object (print it to draw). For
"network" and "states", x, invisibly (cograph draws with base
graphics).
Conditions
hypergraphs_bad_input from plot.net_hg() for arguments passed
through ... that it rejects.
References
Saqr, M., López-Pernas, S., Törmänen, T., Kaliisa, R., Misiejuk, K., & Tikka, S. (2025). Transition network analysis: A novel framework for modeling, visualizing, and identifying the temporal patterns of learners and learning processes. Proceedings of the 15th International Learning Analytics and Knowledge Conference (LAK '25), 351-361. doi:10.1145/3706468.3706513